In this section we will try to have a simple example where in we will use Docker as an container and will use to create three container i..e elastic search, Kibana, fluentbit and try to access our own microservice log in our docker container and will try to access it using above three EFK containers.
As we are using docker desktop on window make sure to have below configuration for the same

Lets start
1- Create elastic docker container
Use below command
docker network create elastic
docker pull docker.elastic.co/elasticsearch/elasticsearch:7.13.0

docker run –name es01-test –net elastic -p 9200:9200 -p 9300:9300 -e “discovery.type=single-node” docker.elastic.co/elasticsearch/elasticsearch:7.13.0
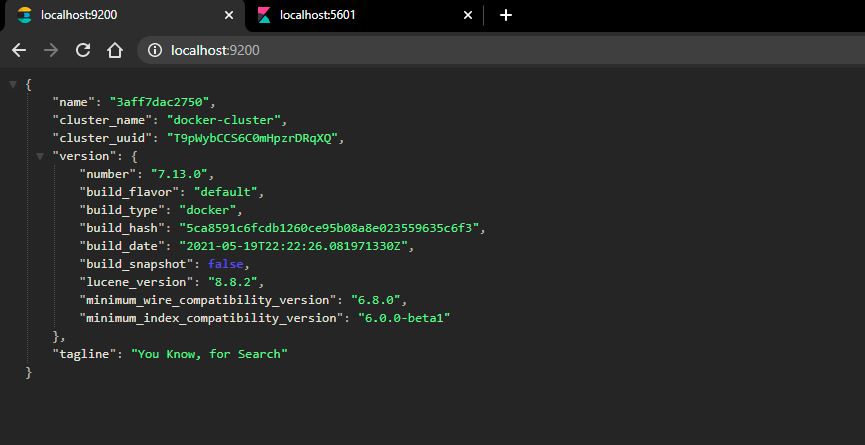
Execute http://localhost:9200 and check you are able to access the url
2- Create kibana docker container.
Use below command
docker pull docker.elastic.co/kibana/kibana:7.13.0

docker run –name kib01-test –net elastic -p 5601:5601 -e “ELASTICSEARCH_HOSTS=http://es01-test:9200” docker.elastic.co/kibana/kibana:7.13.0
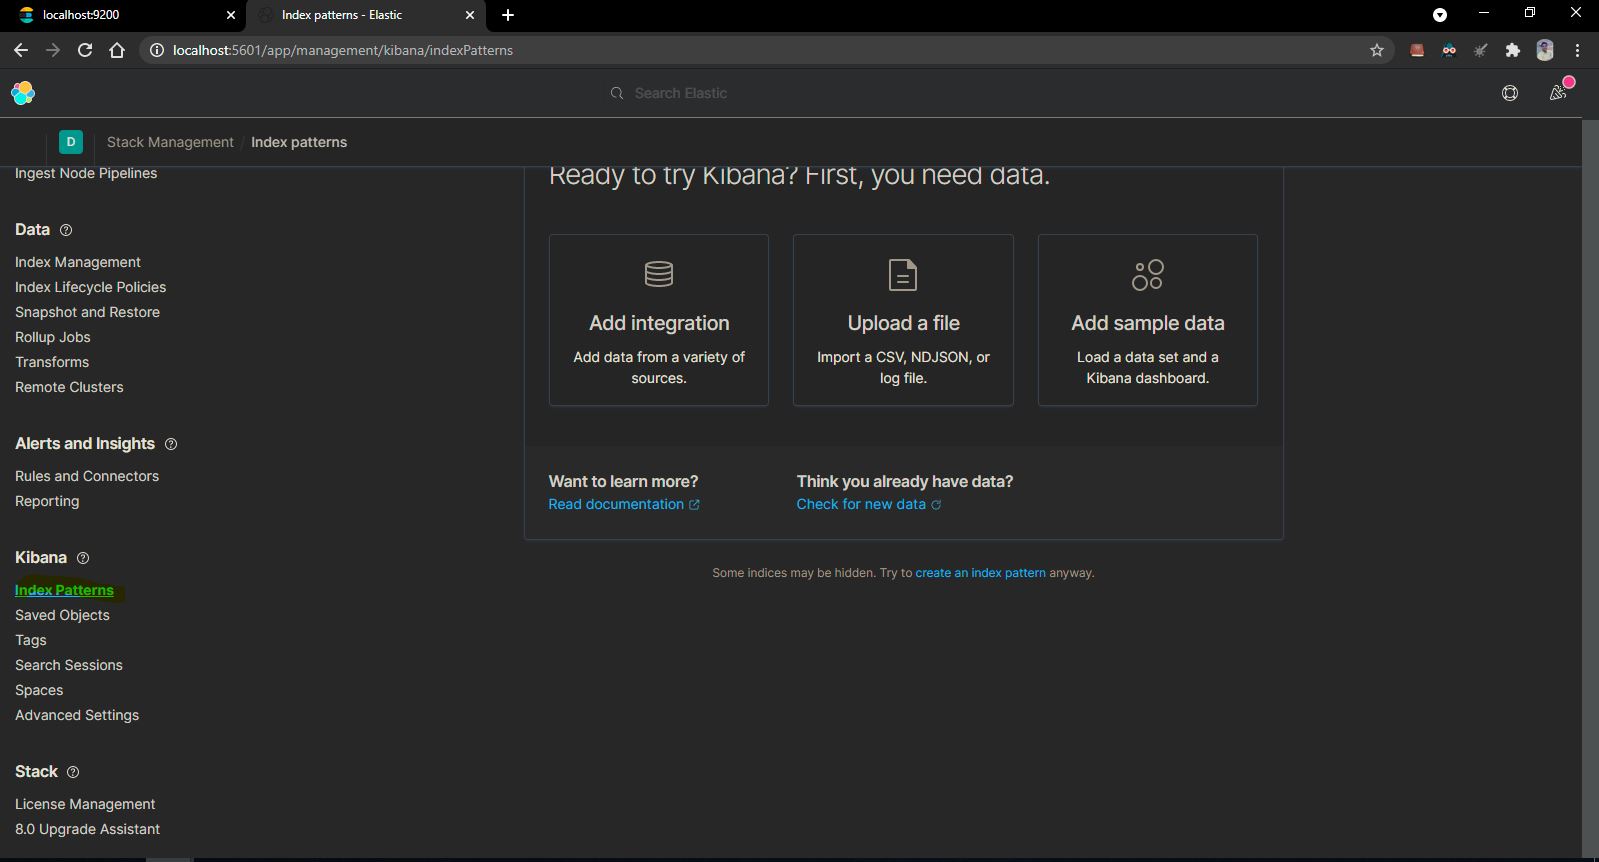
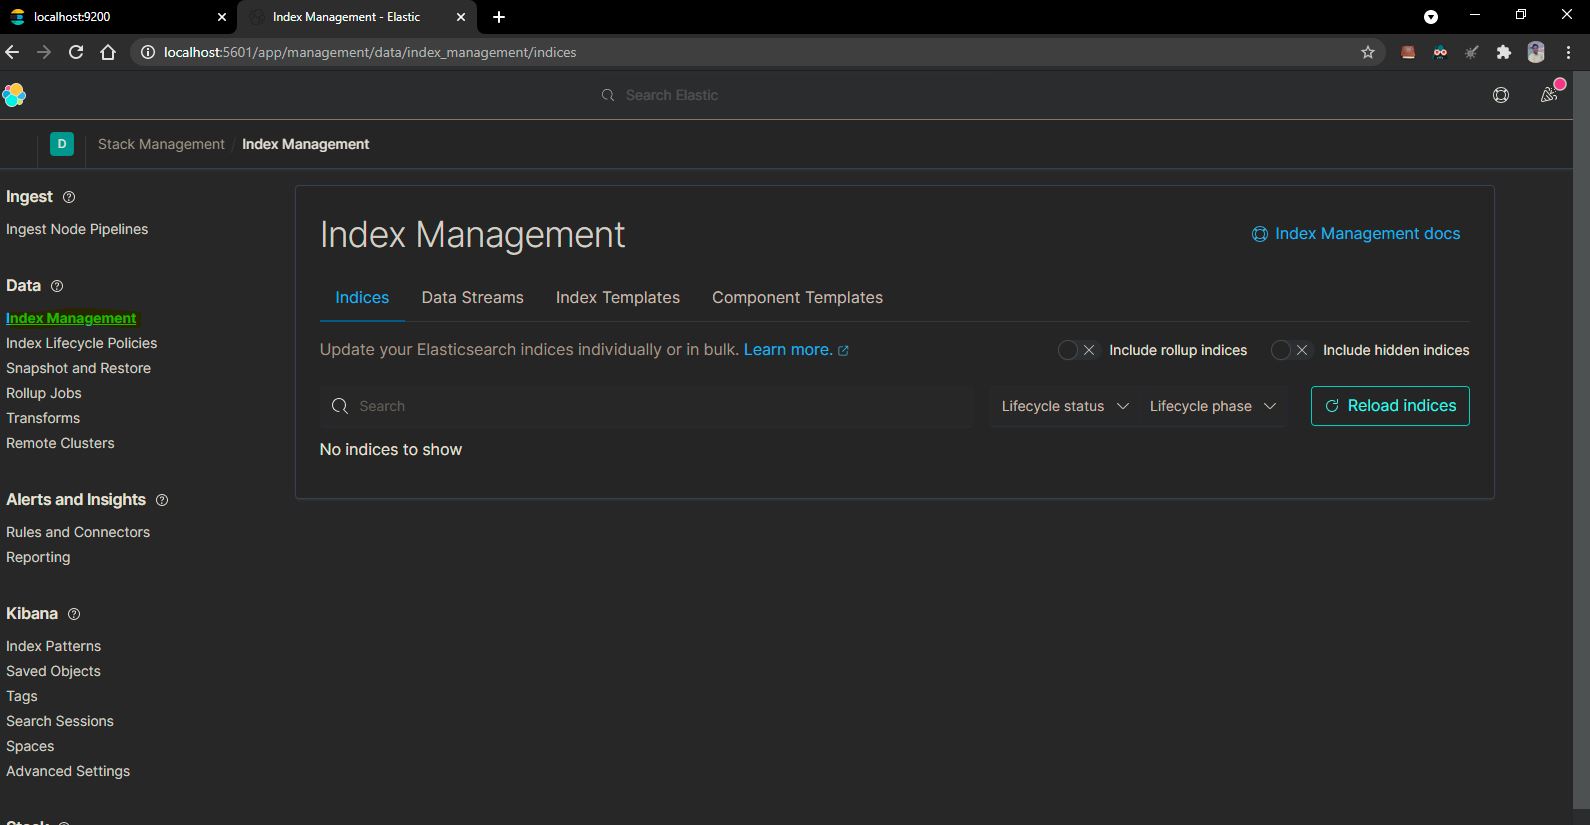
As seen above we dont see any indices because still now we did not add any log collector that will check the docker container log and inject into elastic search that we can view inside kibana. Lets do that in our next step.
3- I have local fluentbit setup.
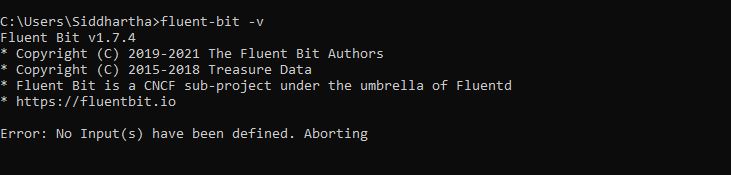
Now lets creat a conf file that will be used as an input parameter to start fluent bit that will read the docker log and inject inside the elastic search which we can then see on Kibana.
C:\fluent-bit-conf-files\docker_to_es.conf
[SERVICE]
Flush 5
Daemon Off
Log_Level info
[INPUT]
Name forward
Listen 192.168.0.14
Port 24224
[OUTPUT]
Name es
Match *
Host 127.0.0.1
Port 9200
Index fluentbit
Type docker
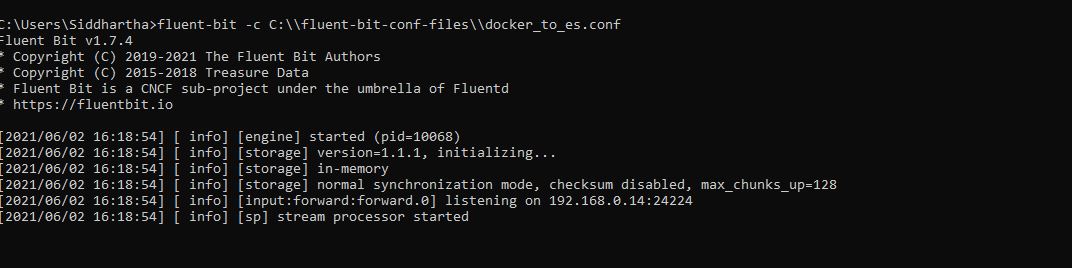
lets run the fluent-bit with the below command now:-
fluent-bit -c C:\fluent-bit-conf-files\docker_to_es.conf
As shown below now your fluentbit is doing streming of the docker data to elastic search DB.
To check if every thing is working let try to hit our setup with ubuntu image as show below
docker run -t -i –log-driver=fluentd –log-opt fluentd-address=192.168.0.14:24224 ubuntu echo “Hello Fluent Bit!”

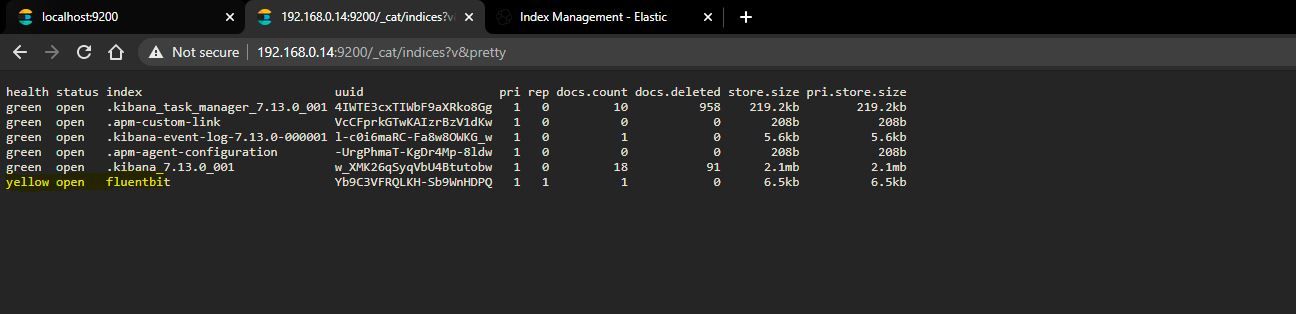
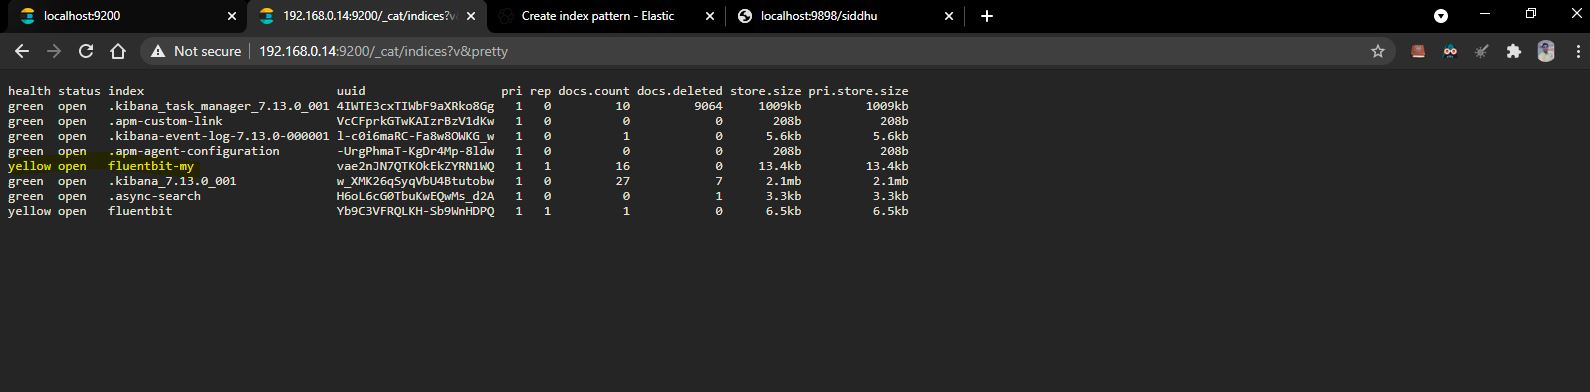
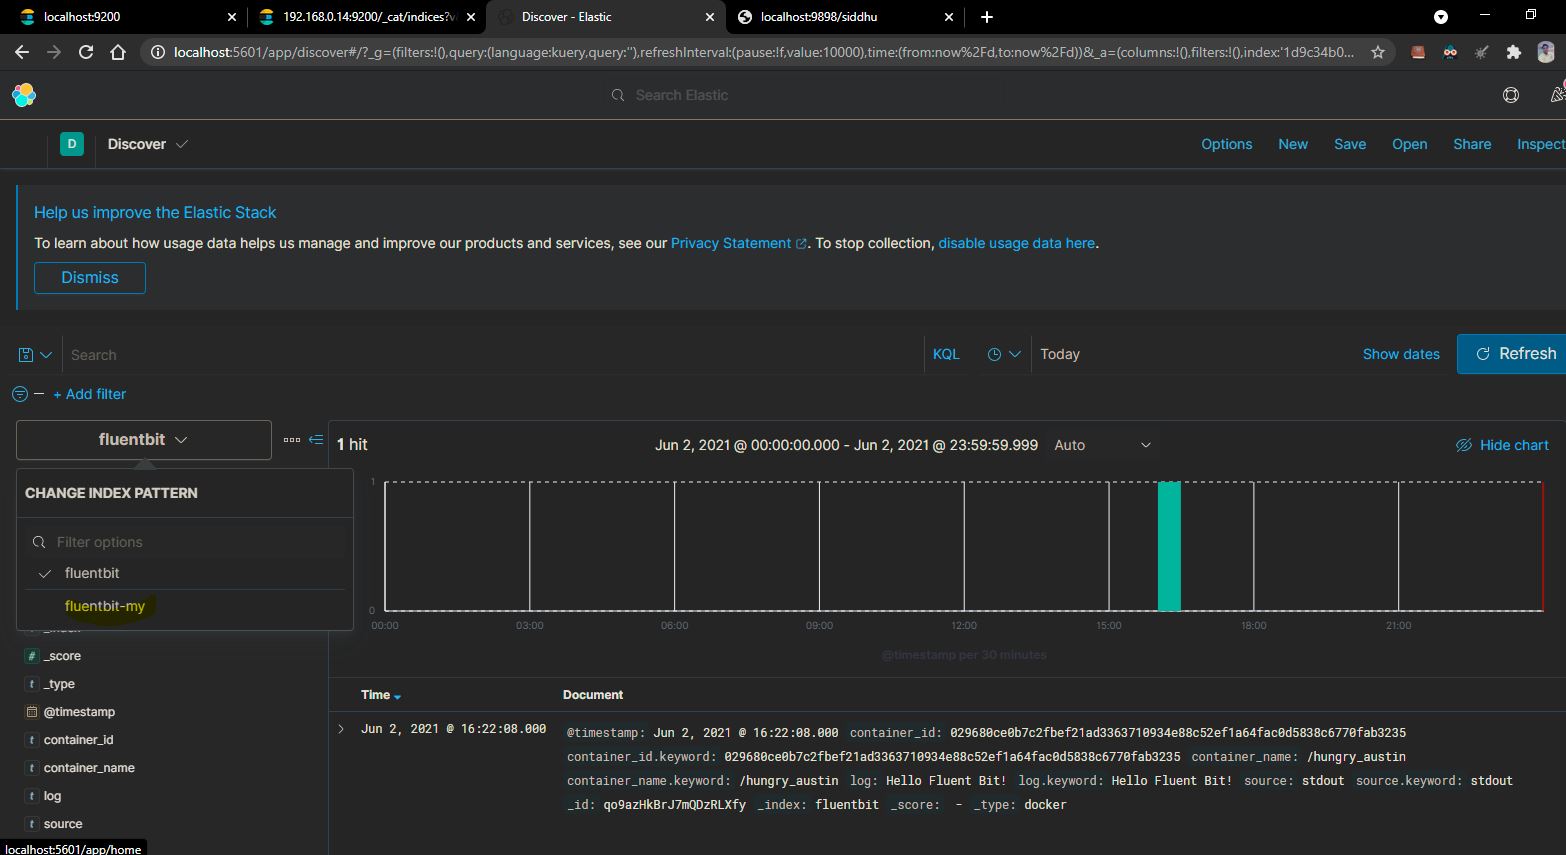
Now check if we are able to see our fluentbit index in elasticsearch and kibana
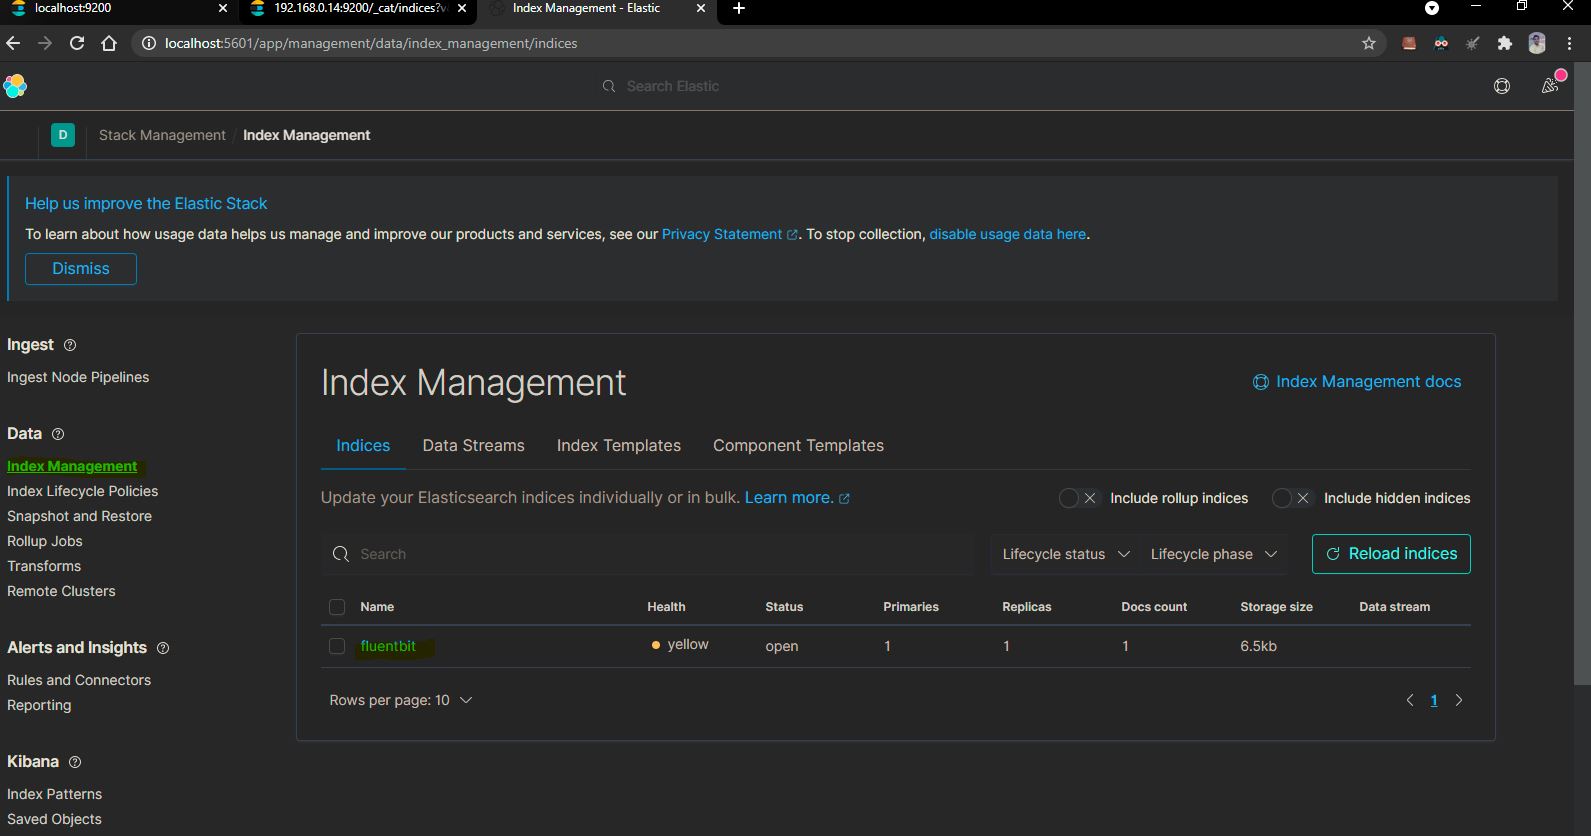
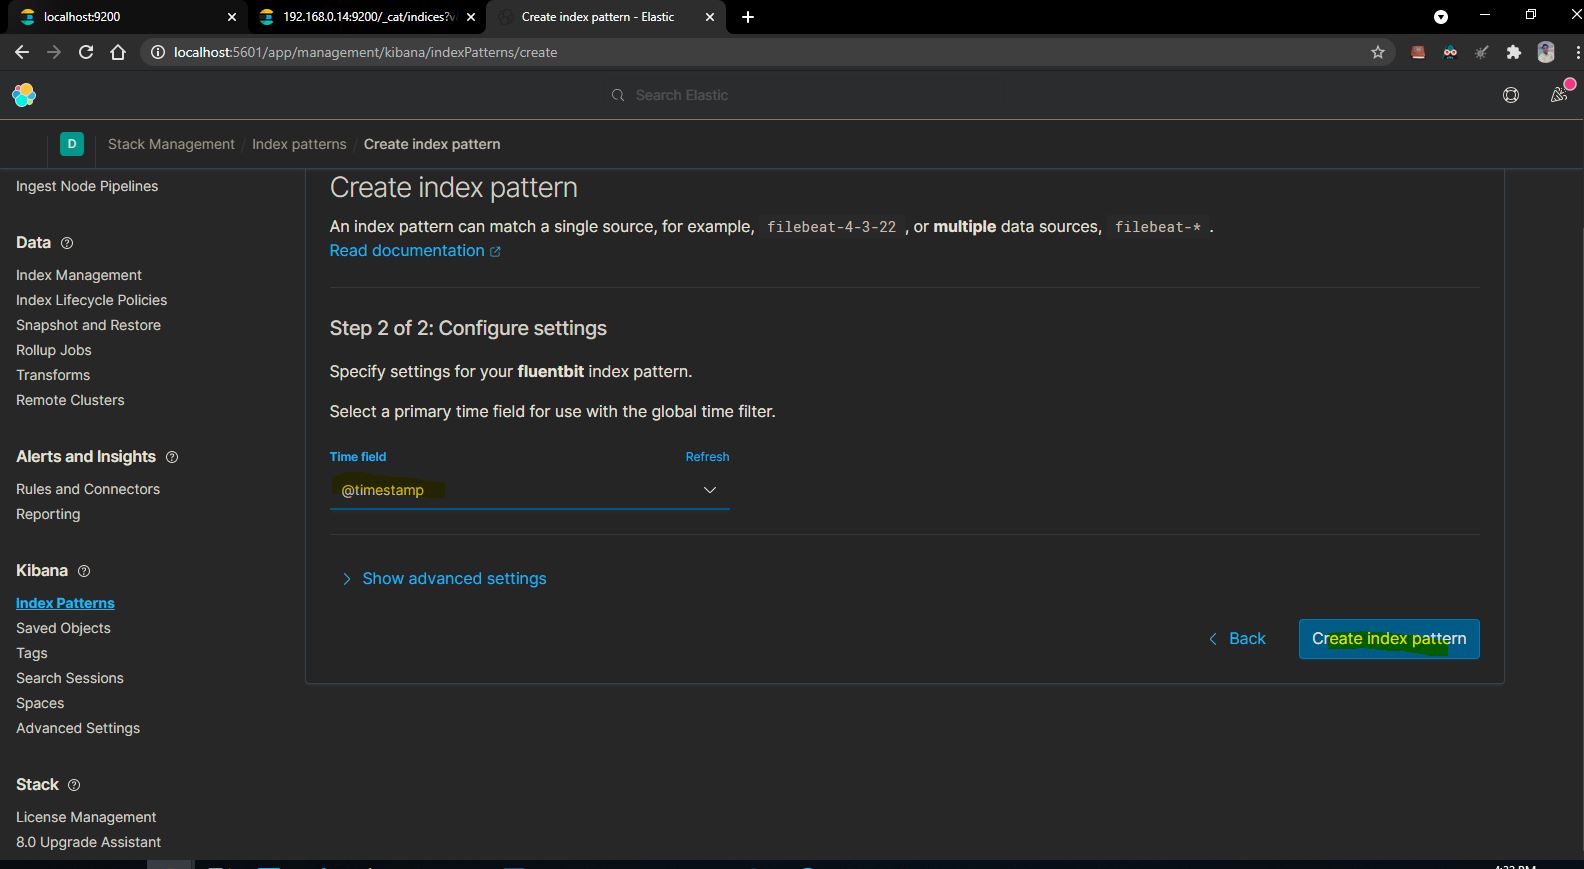
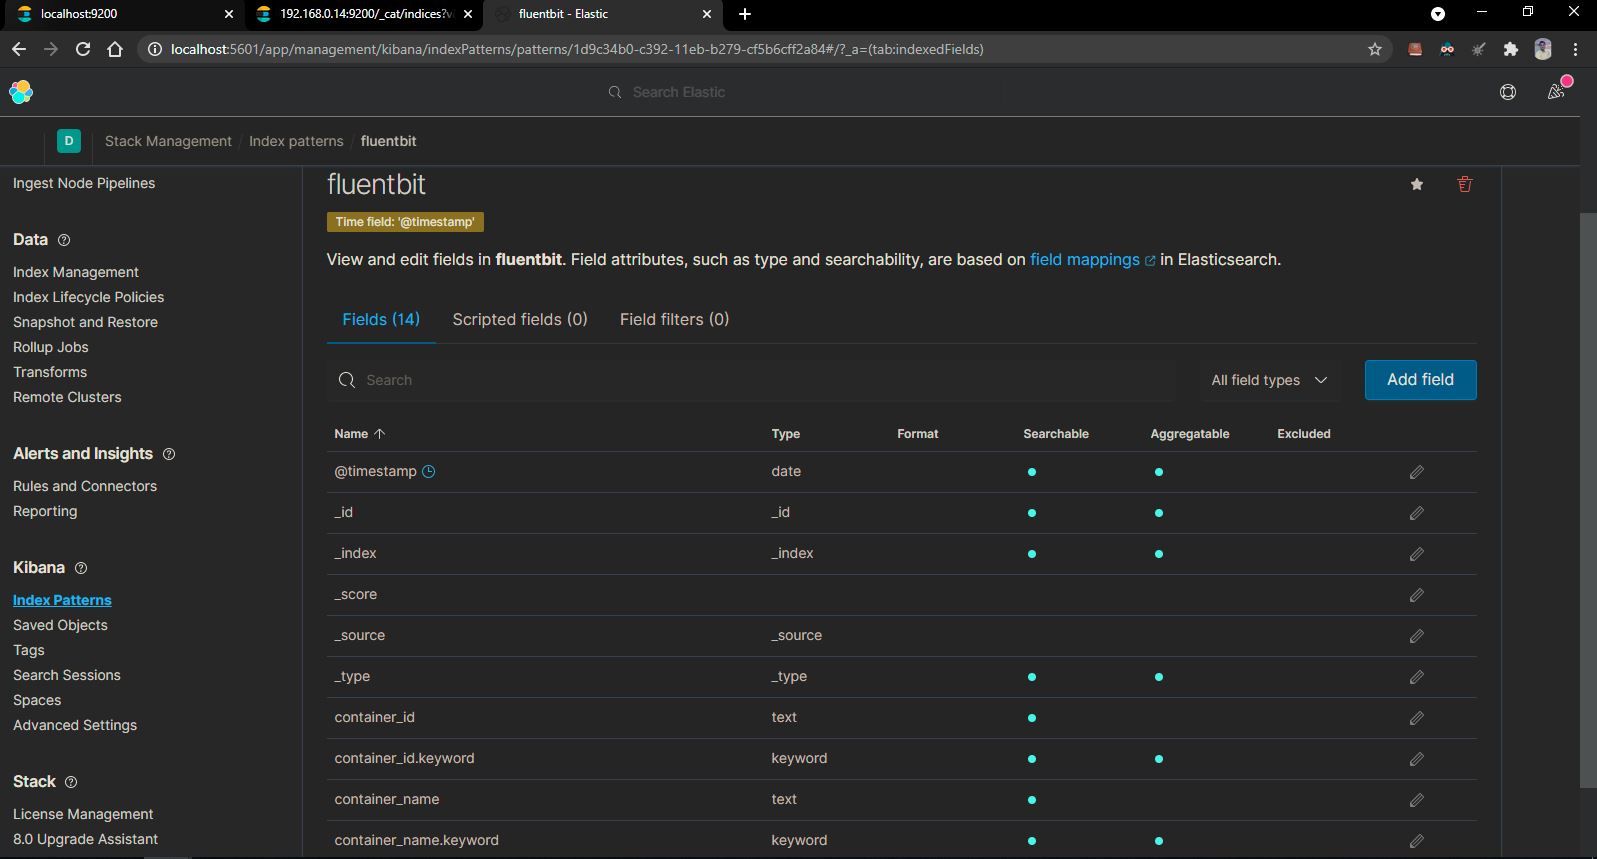
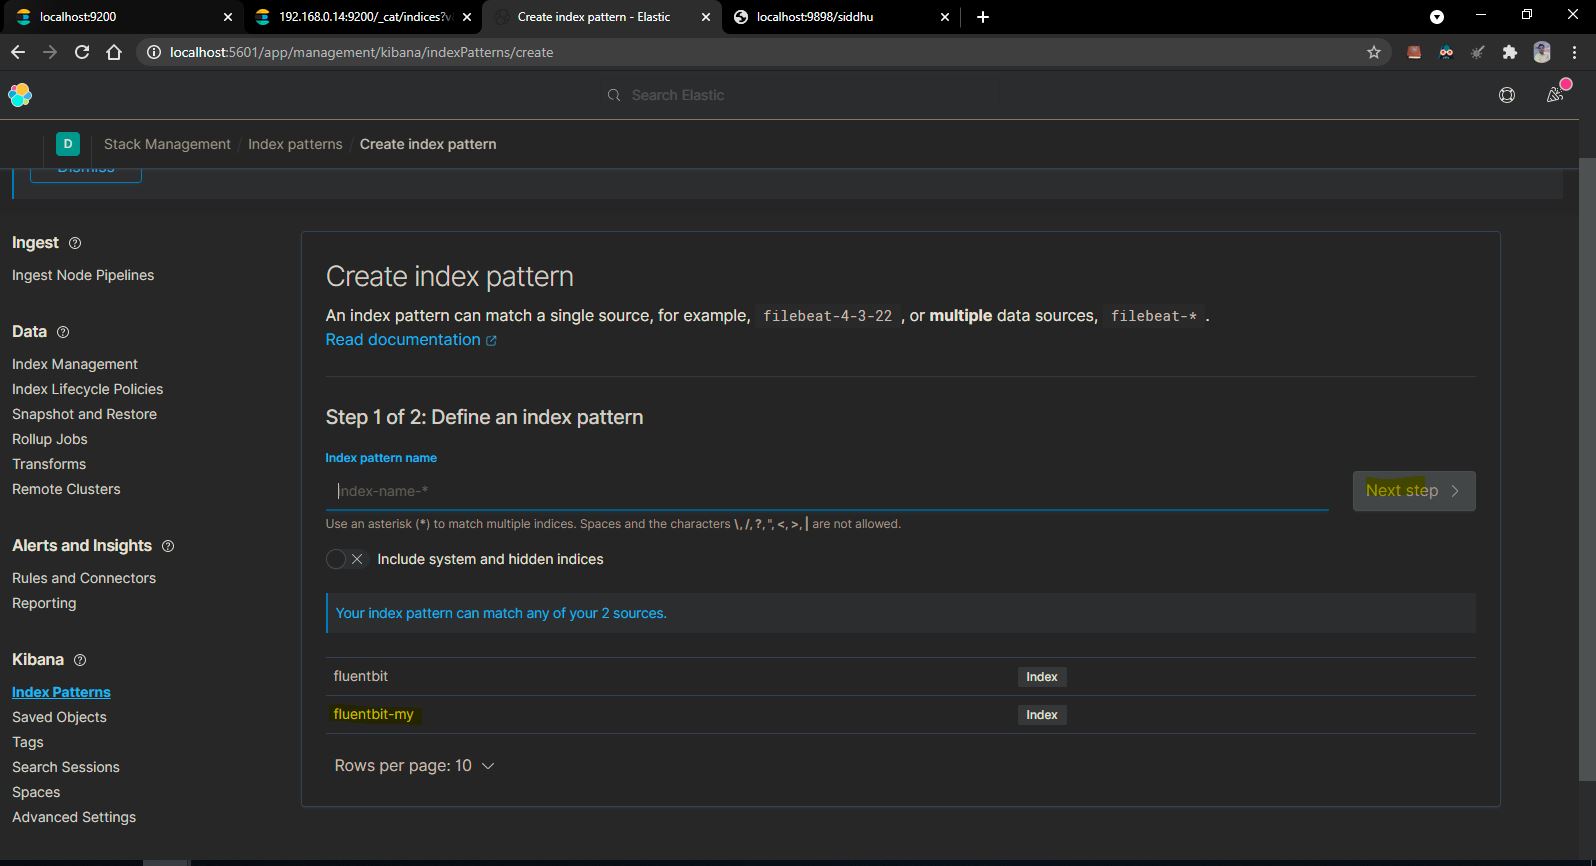
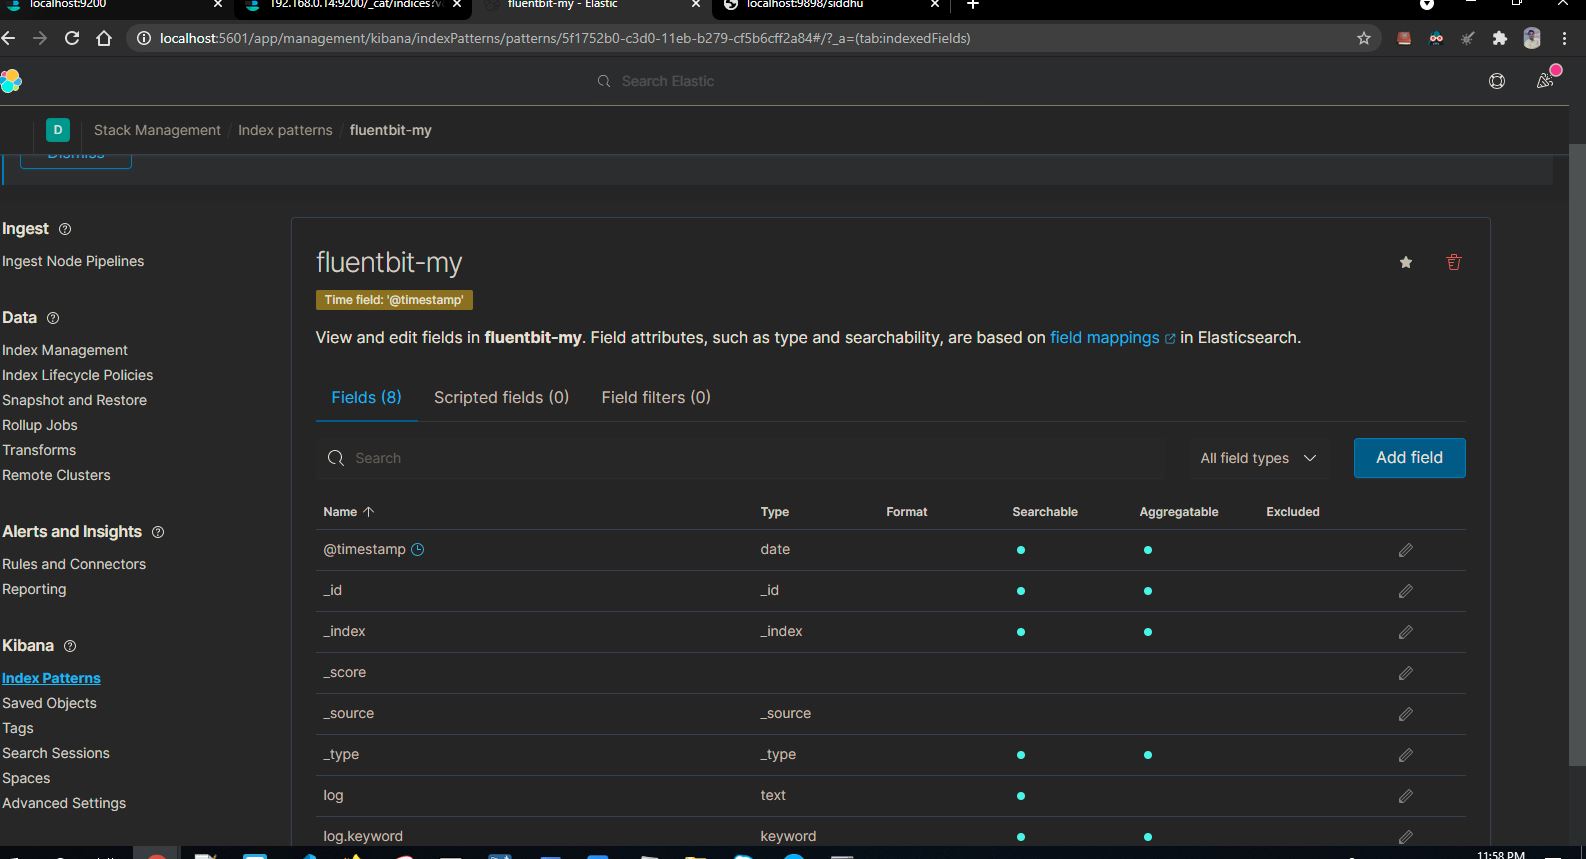
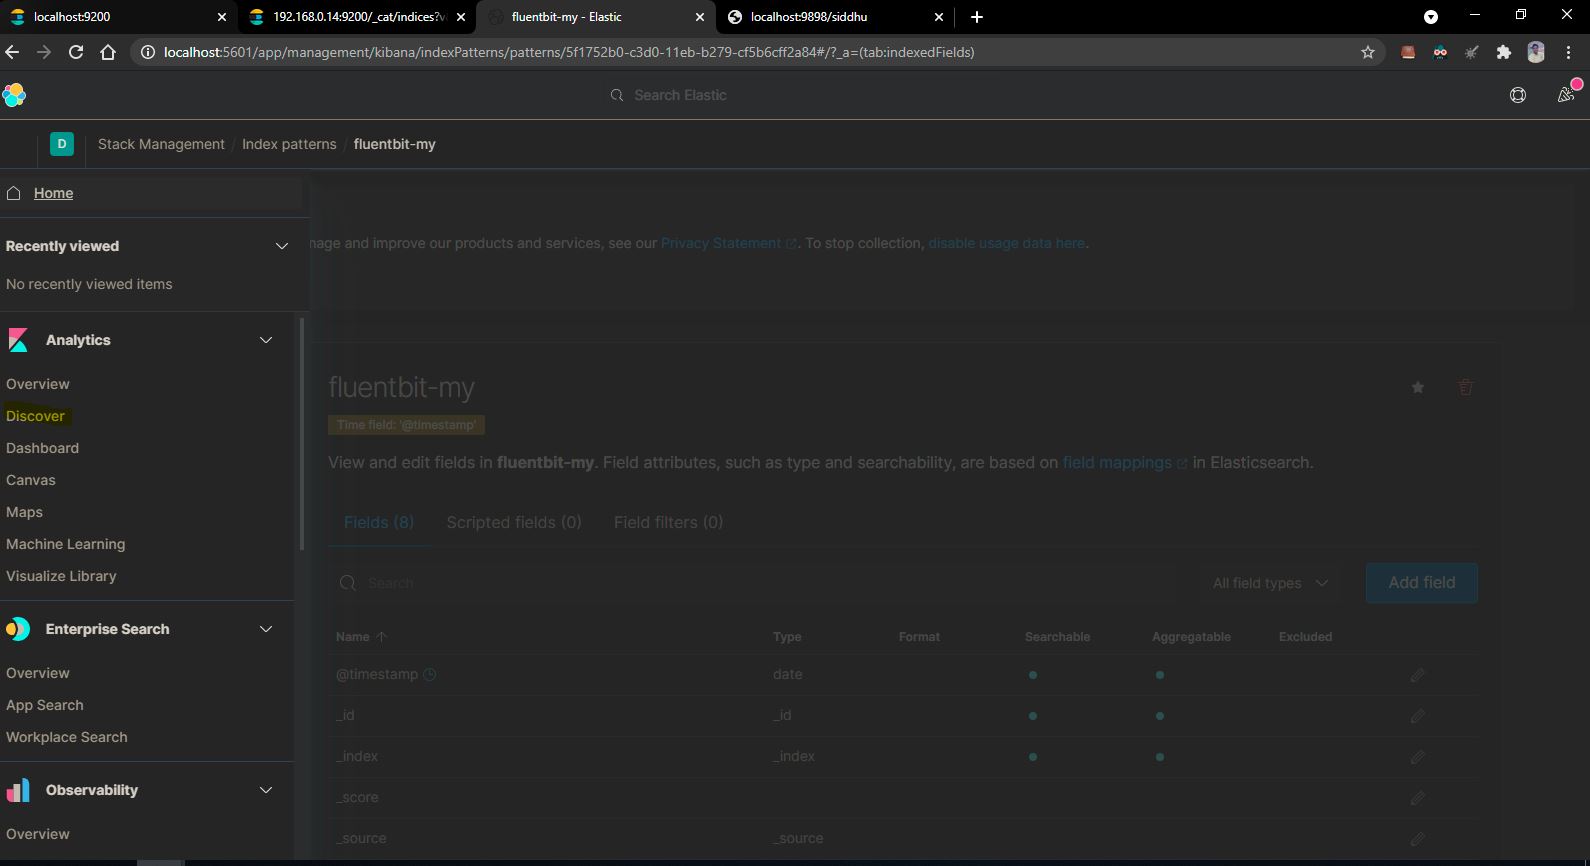
Lets configure this index to our kibana and check if we are getting the logs in kibana


Now lets deploy our microservice docker and check if we are able to see it logs.
Now lets pull our docker image using below command
docker pull shdhumale/efk-springboot-docker-kubernetes:latest

Now we created a new conf file our docker_to_es_ms.conf file to listen to the file where our microservice docker put the logs i.e. /var/log/container folder
C:\fluent-bit-conf-files\docker_to_es_ms.conf
[SERVICE]
Flush 5
Daemon Off
Log_Level info
[INPUT]
Name tail
Path C:\springboot-log\spring-boot-eflk.log
[OUTPUT]
Name es
Match *
Host 127.0.0.1
Port 9200
Index fluentbit-my
fluent-bit -c C:\fluent-bit-conf-files\docker_to_es_ms.conf

Now as you know to access one docker folder from another docker folder we need to use the volume concept.
As shown in below command
-v C:\springboot-log\spring-boot-eflk.log:/var/log/containers/spring-boot-eflk.log
Indicate we are creating a volume in our window machine and is mount with its C:\springboot-log\spring-boot-eflk.log and folder from the docker is /var/log/containers/spring-boot-eflk.log
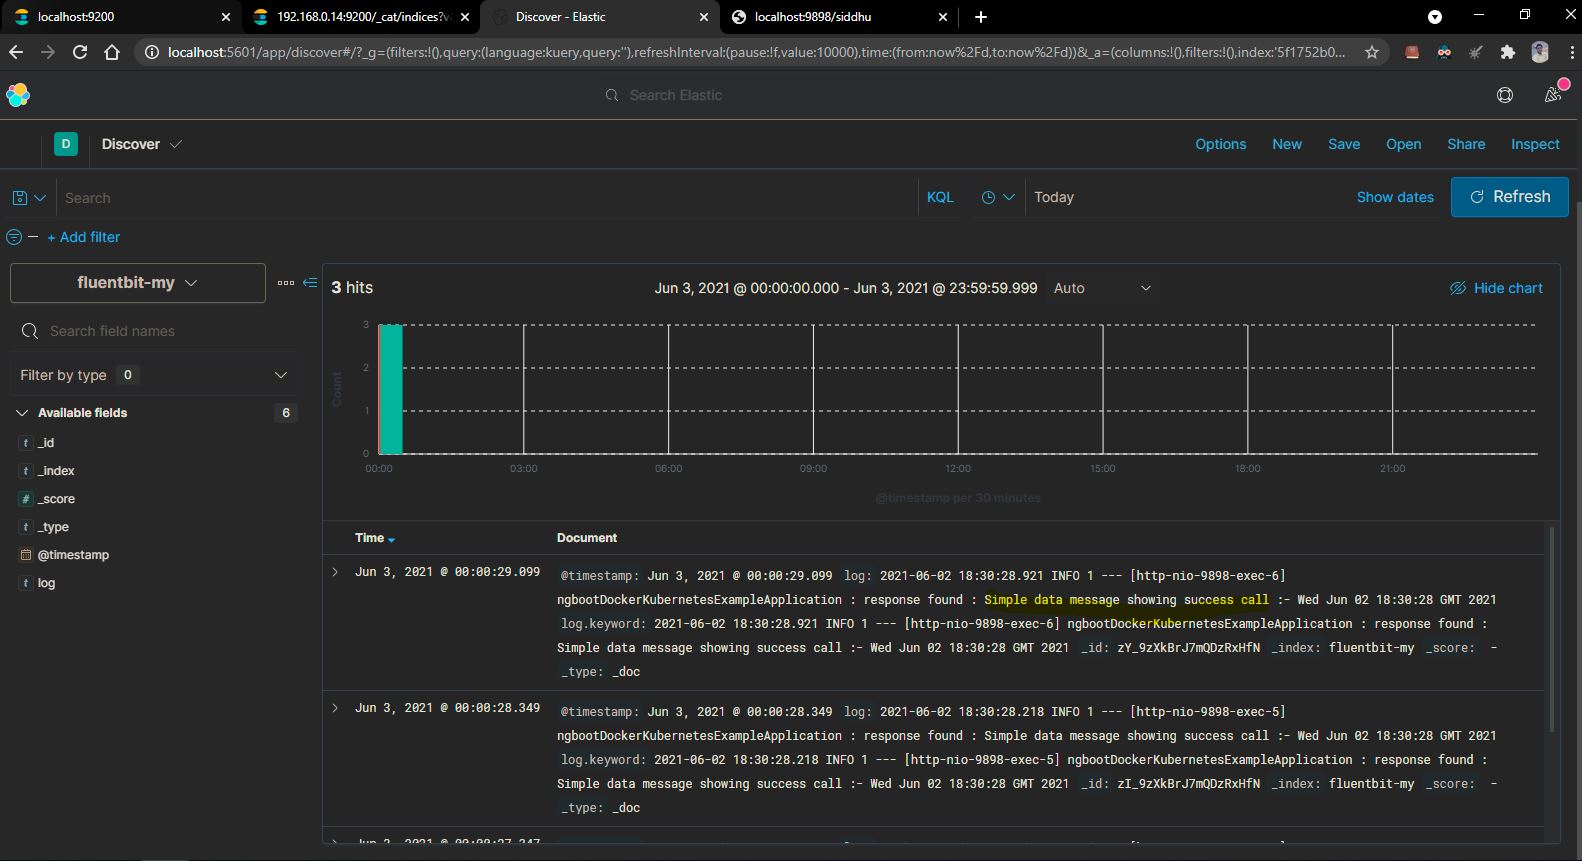
Now run the below command and see if we are able to see the index in elastic search.
docker run –name sd01-test -v C:\springboot-log\spring-boot-eflk.log:/var/log/containers/spring-boot-eflk.log -p 9898:9898 –net elastic shdhumale/efk-springboot-docker-kubernetes:latest
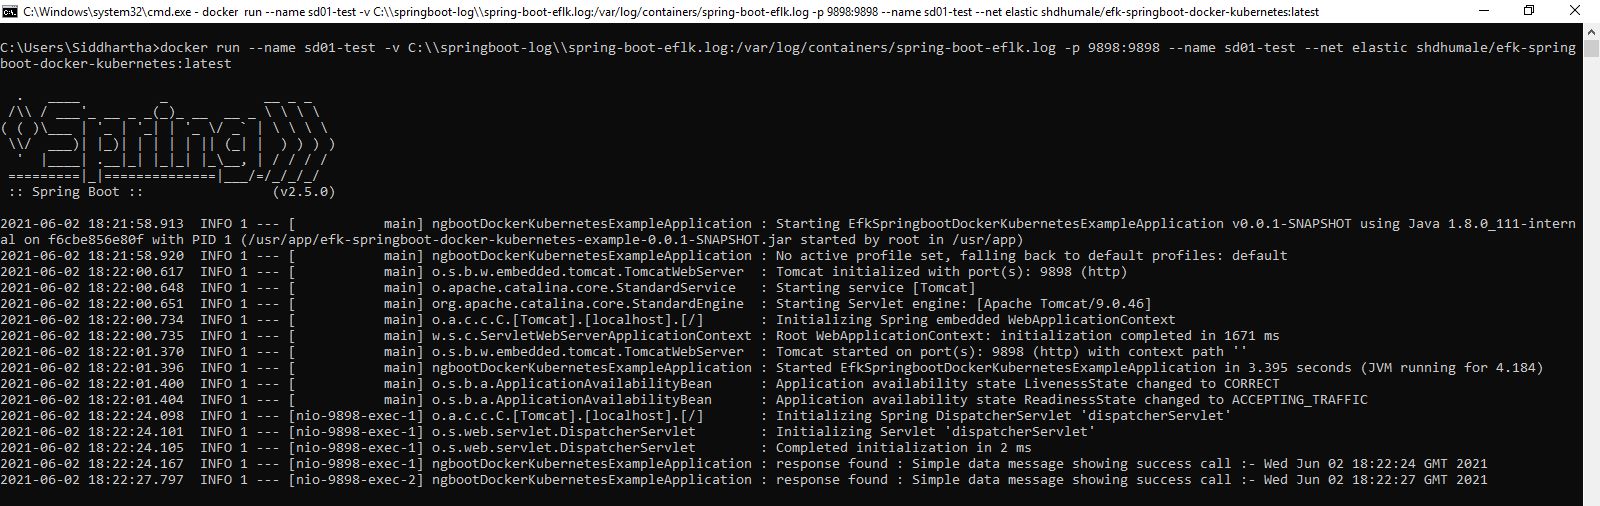


Volume maped on windows folder.

No comments:
Post a Comment