Thursday, December 21, 2023

OpenTelemetry: Embracing a Vendor-Neutral Future for Microservices Observability

 From the dawn of modern applications, IT teams have meticulously monitored their health and performance. This intricate dance involves observing telemetry data – logs, metrics, and traces – emitted by microservices. These insights fuel informed decisions on scaling, maintaining, and troubleshooting applications in production environments.

Yet, amidst the plethora of existing monitoring and observability tools, a question arises: why is OpenTelemetry gaining such significant traction? What makes it stand out in this crowded space, and how does it benefit developers, DevOps teams, and SREs?

Enter OpenTelemetry: a game-changer in the realm of microservices observability. It empowers IT teams to transcend vendor lock-in and embrace a future of flexibility and deeper insights.

At its core, OpenTelemetry establishes a standardized approach to collecting and exporting telemetry data. This open-source framework champions vendor neutrality, enabling seamless integration with any compatible observability backend – open-source or proprietary.

But OpenTelemetry’s impact extends far beyond mere choice. It fosters an environment of:

  • Unparalleled flexibility: Choose the components that best suit your needs, from collectors and exporters to instrumentation libraries. OpenTelemetry welcomes customization and open-source contributions, empowering you to tailor your observability setup for maximum effectiveness.
  • Richer data landscapes: Gain granular insights into the inner workings of your microservices. OpenTelemetry transcends network-level observability (offered by tools like Istio) by providing detailed code-level tracing, illuminating the intricate workings of your applications.
  • Seamless integration: OpenTelemetry plays nice with a vast array of programming languages and observability tools. No need to rip and replace your existing stack – OpenTelemetry seamlessly integrates with your current infrastructure.

Through its standardized data formats and diverse integrations, OpenTelemetry empowers developers and simplifies operations:

  • Developers: Debug issues faster and pinpoint performance bottlenecks with fine-grained code-level tracing. OpenTelemetry puts the power of observability directly in your hands, enabling proactive problem-solving and optimized application performance.
  • DevOps and SREs: Correlate data across services, identify anomalies, and proactively address issues before they impact users. OpenTelemetry grants a unified view of your entire microservices landscape, regardless of the underlying tools, promoting informed decision-making and ensuring service resilience.

OpenTelemetry represents more than just a technological paradigm shift; it fosters a collaborative community of developers and vendors. This vibrant ecosystem ensures continuous innovation, readily-available resources, and robust support for getting started with OpenTelemetry.

Embrace the future of microservices observability with OpenTelemetry. Break free from vendor lock-in, gain deeper insights, and empower your teams to build and operate resilient, high-performing systems. Start your journey today and experience the freedom and power of truly open, vendor-neutral observability.

OpenTelemetry is the Game Changer for Microservices Observability

Ditch vendor lock-in and gain deeper insights into your microservices with OpenTelemetry, the open-source standard for vendor-neutral observability. Learn how it empowers developers and simplifies operations.

Microservices have revolutionized software development, enabling agility and scalability. But with great power comes great complexity. Monitoring and troubleshooting distributed systems across clouds can be a nightmare, often leading to vendor lock-in and siloed data. Enter OpenTelemetry, a game-changer in the realm of microservices observability.

OpenTelemetry to the Rescue: Breaking Free from Vendor Lock-in

Imagine a world where you’re not chained to a single observability vendor. A world where you can freely choose the tools that best fit your needs without worrying about data compatibility or code rewrites. OpenTelemetry makes this dream a reality by establishing a standardized approach to collecting and exporting telemetry data from your microservices.

This open-source framework provides several key benefits:

  • Vendor neutrality: Instrument your applications once, and send data to any compatible backend, be it open-source or proprietary. No more vendor lock-in!
  • Flexibility: Choose the components that suit your needs, from collectors and exporters to instrumentation libraries. Want to build your own tools? OpenTelemetry welcomes open-source contributions.
  • Rich data insights: Gain deeper understanding of your microservices with detailed traces, logs, and metrics, both at the application and network layer. Istio provides network-level insights, while OpenTelemetry shines a light on the inner workings of your applications.
  • Seamless integration: OpenTelemetry plays nice with a wide range of programming languages and observability tools. No need to rip and replace your existing stack.

Empowering Developers and Simplifying Operations

OpenTelemetry isn’t just about breaking free from vendors. It’s about empowering developers and simplifying operations:

  • Developers: Gain fine-grained insights into application performance, pinpoint bottlenecks, and debug issues faster with code-level tracing. No more chasing blind alleys – OpenTelemetry puts the power of observability directly in your hands.
  • DevOps and SREs: Get a unified view of your entire microservices landscape, regardless of the underlying tools. Correlate data across services, identify anomalies, and proactively address issues before they impact users.

OpenTelemetry: More Than Just a Standard, It’s a Community

OpenTelemetry is backed by a thriving community of developers and vendors. This collaborative spirit ensures continuous innovation and a wealth of resources for getting started. From documentation and tutorials to sample code and integrations, the OpenTelemetry community has your back.

Ready to Embrace the Future of Microservices Observability?

OpenTelemetry represents a paradigm shift in how we monitor and understand our microservices. It’s not just a technology; it’s a philosophy of vendor neutrality, flexibility, and deeper insights. If you’re tired of vendor lock-in and siloed data, and want to empower your developers and simplify operations, then OpenTelemetry is the answer you’ve been waiting for.

So, dive into the world of OpenTelemetry and experience the freedom and power of truly open, vendor-neutral observability. The future of microservices is bright, and OpenTelemetry is leading the way.

To understand in details about What Is OpenTelemetry?
OpenTelemetry (OpenTelemetry) provides open-source standards and formats for collecting and exporting telemetry data from microservices for observability purposes. The standardized way of collecting data helps DevOps and SRE engineers use any compatible observability backend of their choice to observe services and infrastructure, without being vendor locked-in. Please refer to the below link
https://opentelemetry.io/

Open telemetry has three basic part

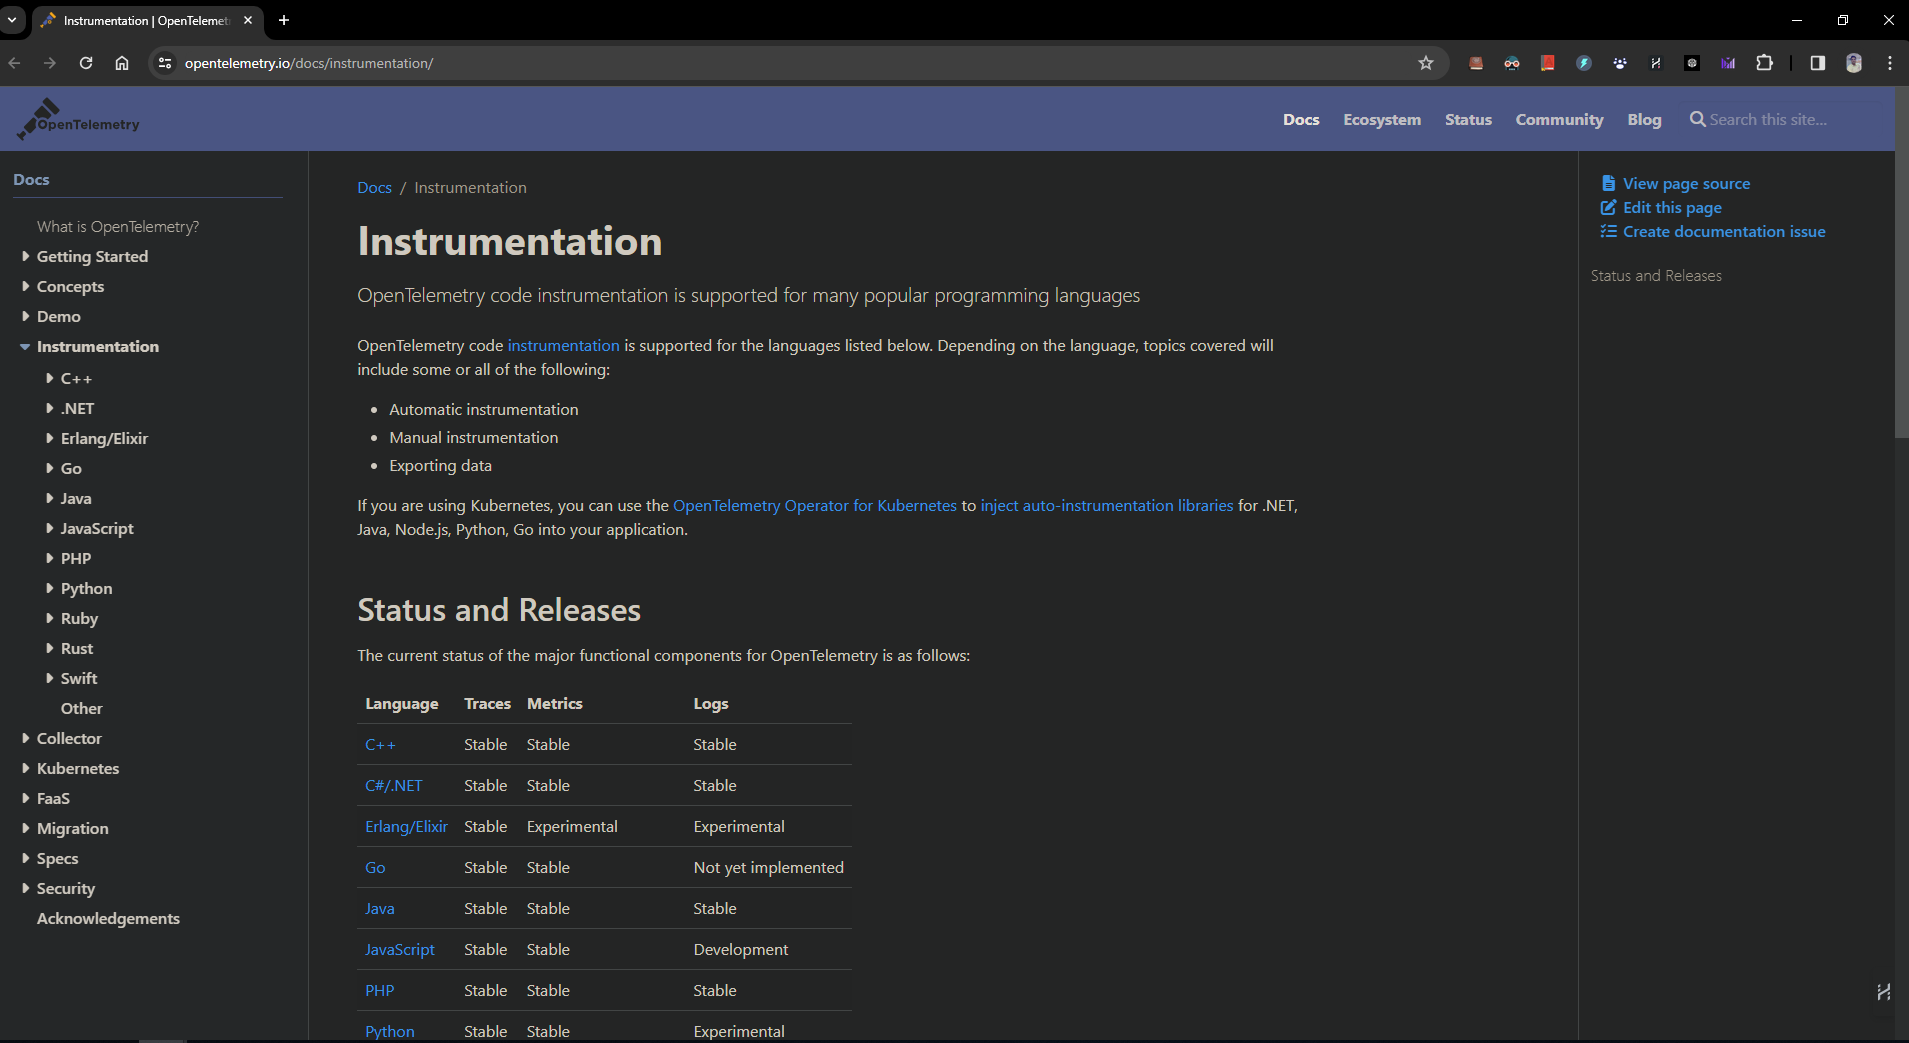
1- Instrumentation Library
OpenTelemetry provides SDKs and libraries for application developers to instrument their code manually or automatically. This provide sdk to integrate with client application to whom we want to monitor. It support huge programming langugage please refer to the below url.

https://opentelemetry.io/docs/instrumentation/

2-OpenTelemetry Collector (OTC)
The collector has receiver, processor, and exporter components, which gather, process, and export telemetry data from instrumented applications or infrastructure to observability backends for visualization
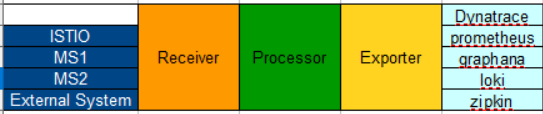
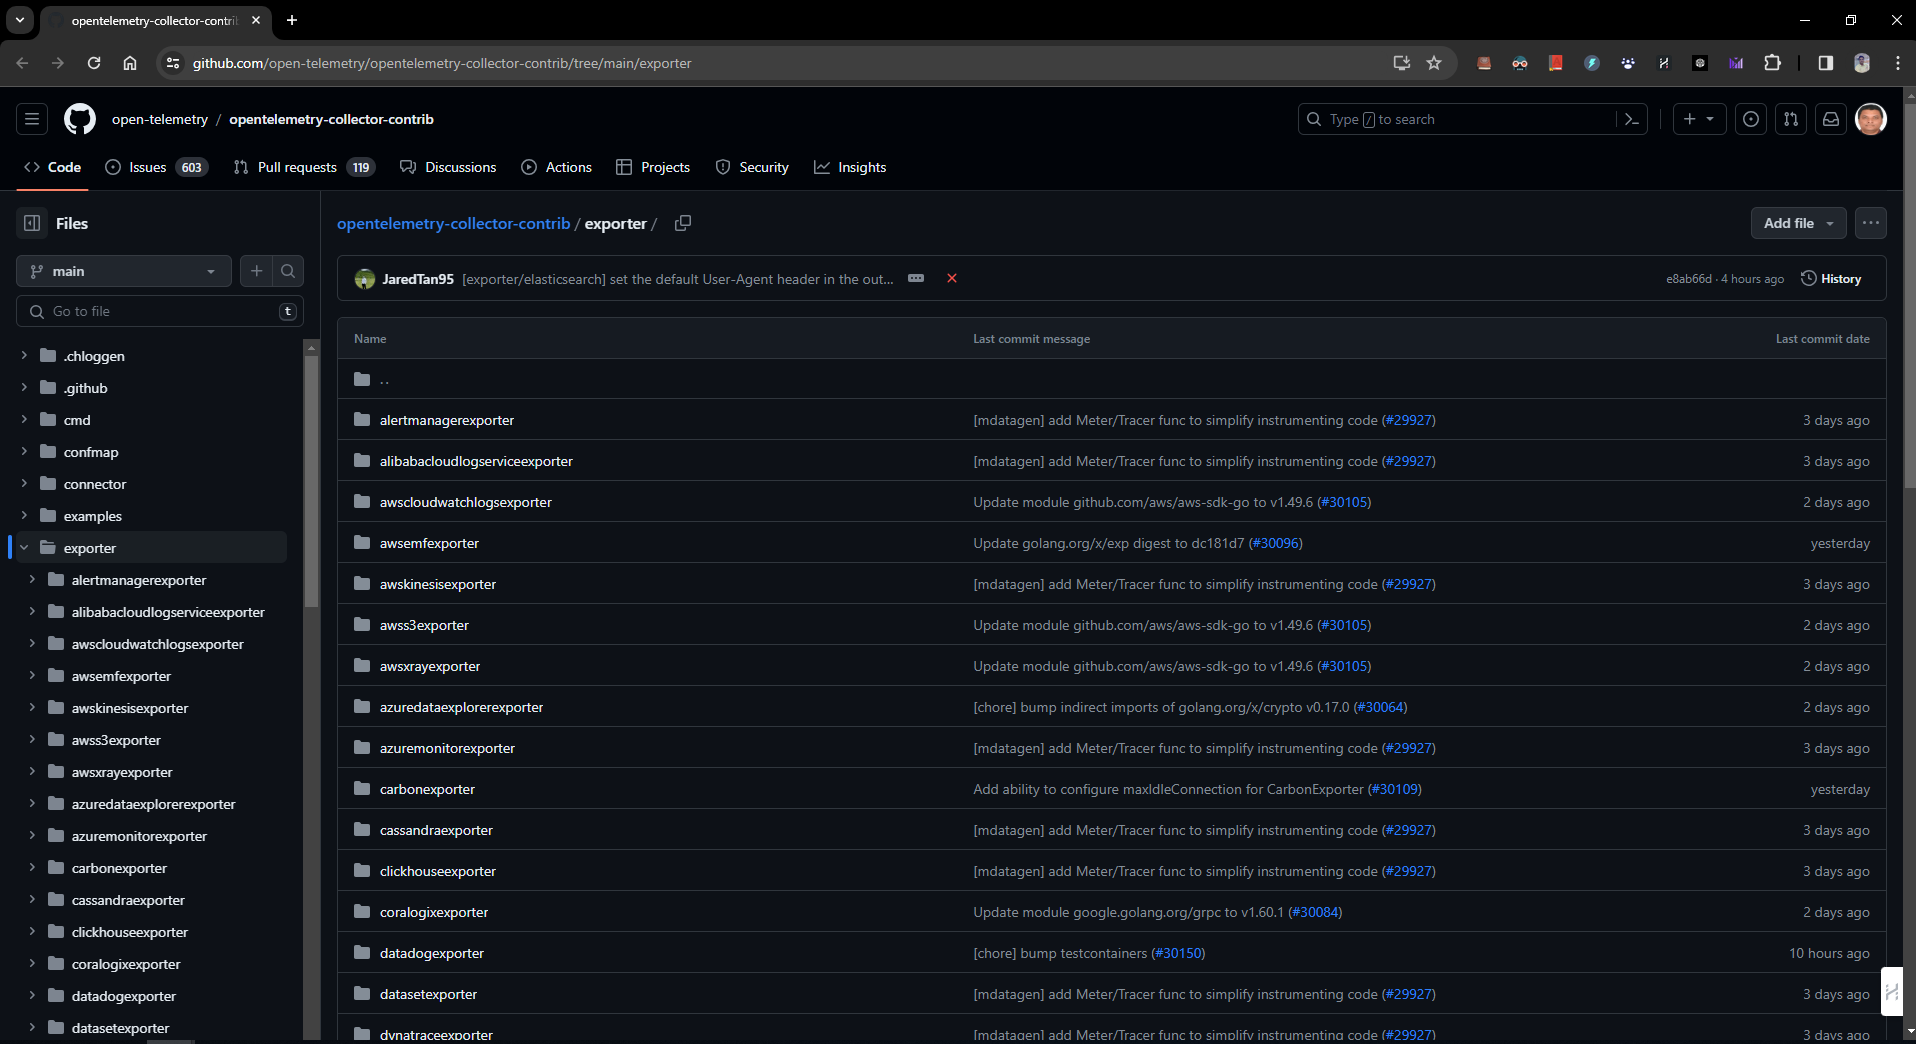
3- Exporters
They allow developers to configure any compatible backend they want to send the processed telemetry data to. There are open-source and vendor-specific exporters available. Some of them are Apache Skywalking, Prometheus, Datadog, and Dynatrace, which are part of the contrib projects. You can see the complete list of vendors who provide exporters.

https://github.com/open-telemetry/opentelemetry-collector-contrib/tree/main/exporter

Here are the key takeaways from the web page chunk

  • OpenTelemetry is an open-source standard for collecting telemetry data from microservices. This means you can avoid vendor lock-in and use a variety of observability tools.
  • It prevents vendor lock-in by standardizing telemetry data collection and exportation. This makes it easy to switch between different observability tools without having to rewrite code.
  • ️ It provides vendor-agnostic components for fetching, processing, and exporting telemetry data. These components include an instrumentation library, collector, and exporters.
  • It’s modular and flexible, so you can pick and choose the components that best fit your needs. You can even add custom components.
  • It supports a wide range of programming languages and observability backends. This makes it a good choice for a variety of applications and environments.
  • I worked with ISTIO service mesh and i found it isdifferent from Istio in that it focuses on the application layer, while Istio focuses on the networking layer. This means that OpenTelemetry can provide more detailed insights into the performance of individual applications.
  • OpenTelemetry tracing provides insights into the application layer, while Istio tracing focuses on the networking layer. vs
  • This means OpenTelemetry can help developers pinpoint the specific function causing latency issues within an application.
  • OpenTelemetry promotes vendor neutrality for microservices observability.
  • IT teams can choose their preferred observability backend without affecting central visibility.
  • OpenTelemetry supports various data formats and integrates with most open-source and vendor-specific tools.
  • This flexibility makes switching between vendors easy.

Hashtags: #OpenTelemetry #MicroservicesObservability #VendorNeutral #CloudNative #DevOps #SoftwareDevelopment #ApplicationPerformance #DistributedTracing #OpenSource #CommunityPowered

Wednesday, December 20, 2023

Ostara FOSS Admin App for Spring Boot

 Tame Your Spring Boot Zoo with Ostara: Free Admin App to the Rescue!

Tired of wrestling with Spring Boot app management? Ostara, a free admin app, is your superhero! Monitor, control, and analyze your apps with ease.
. Spring Boot apps are awesome, but managing them can turn into a tangled mess. Enter Ostara, a free and open-source admin app that’s like a superhero for your Spring Boot microservices.

Ostara gives you superpowers like:

Real-time X-ray vision: Monitor app health, logs, and metrics like a hawk, spotting issues before they wreak havoc.
Effortless control panel: Tweak settings, clear caches, and more with a click, no server restarts needed.
Instant setup, zero fuss: Download, add your app URL, and boom! You’re in control.
Deep insights, endless customization: Analyze data, explore connections, and personalize your Ostara experience.
Organized chaos: Group apps, access settings, and keep everything tidy in one place.
Early warning system: Set up alerts to stay ahead of any hiccups before they become disasters.
Log detective: Stream or download logs for quick troubleshooting, like a digital Sherlock Holmes.
Effortless learning: Clear docs and FAQs make Ostara your new best friend, not a cryptic foe.
Workflow whisperer: Save time and effort, letting Ostara handle the heavy lifting, so you can focus on what matters.
Ostara is constantly evolving, with a roadmap of exciting features and the power to accept your suggestions. It’s like having a Spring Boot whisperer in your corner, keeping your apps happy and healthy.

So, ditch the tangled mess and unleash the power of Ostara. Your Spring Boot apps will thank you!

Ostara is Free & Open Source Admin App for Spring Boot: Manage & monitor your Spring Boot apps and microservices easily.

  • Real-Time Monitoring: See live metrics, health status, logs, and more – identify & diagnose issues quickly.
  • ️ Simple Management: User-friendly UI for managing logs, caches, threads, toggles, and more. No server restarts needed.
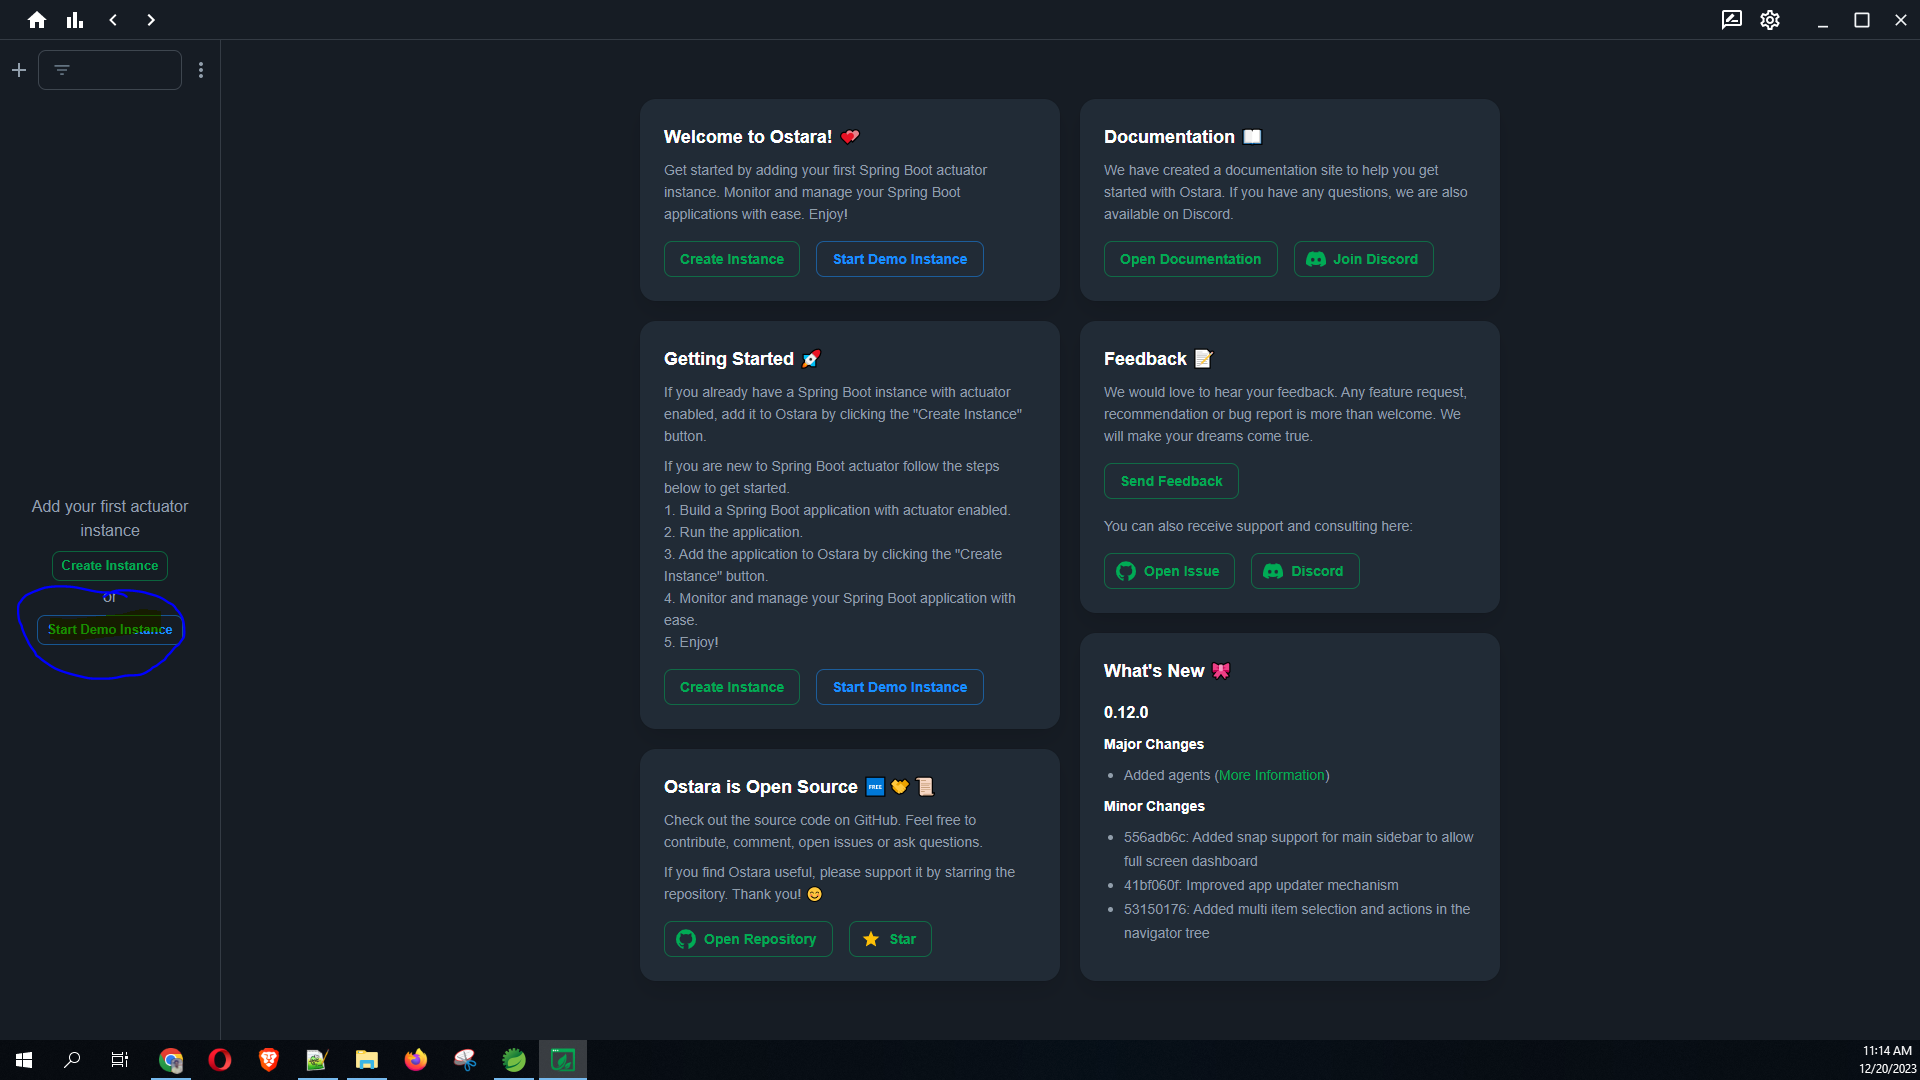
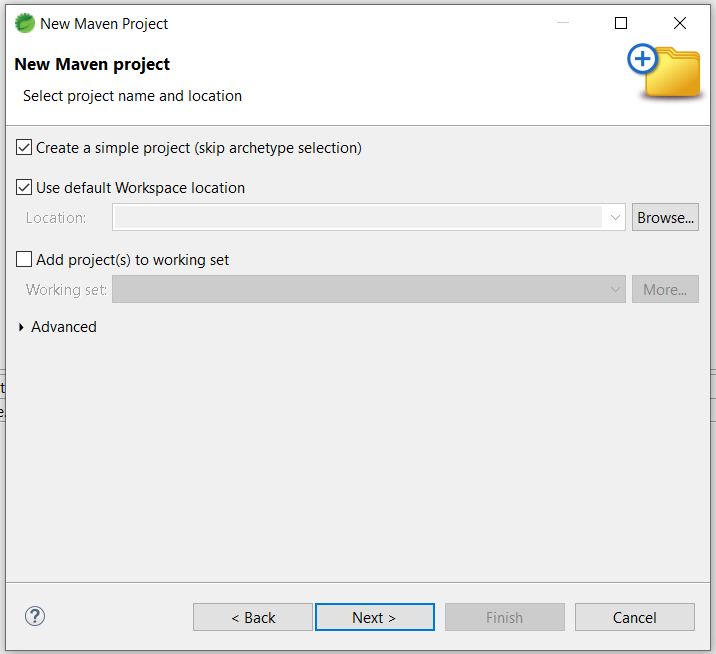
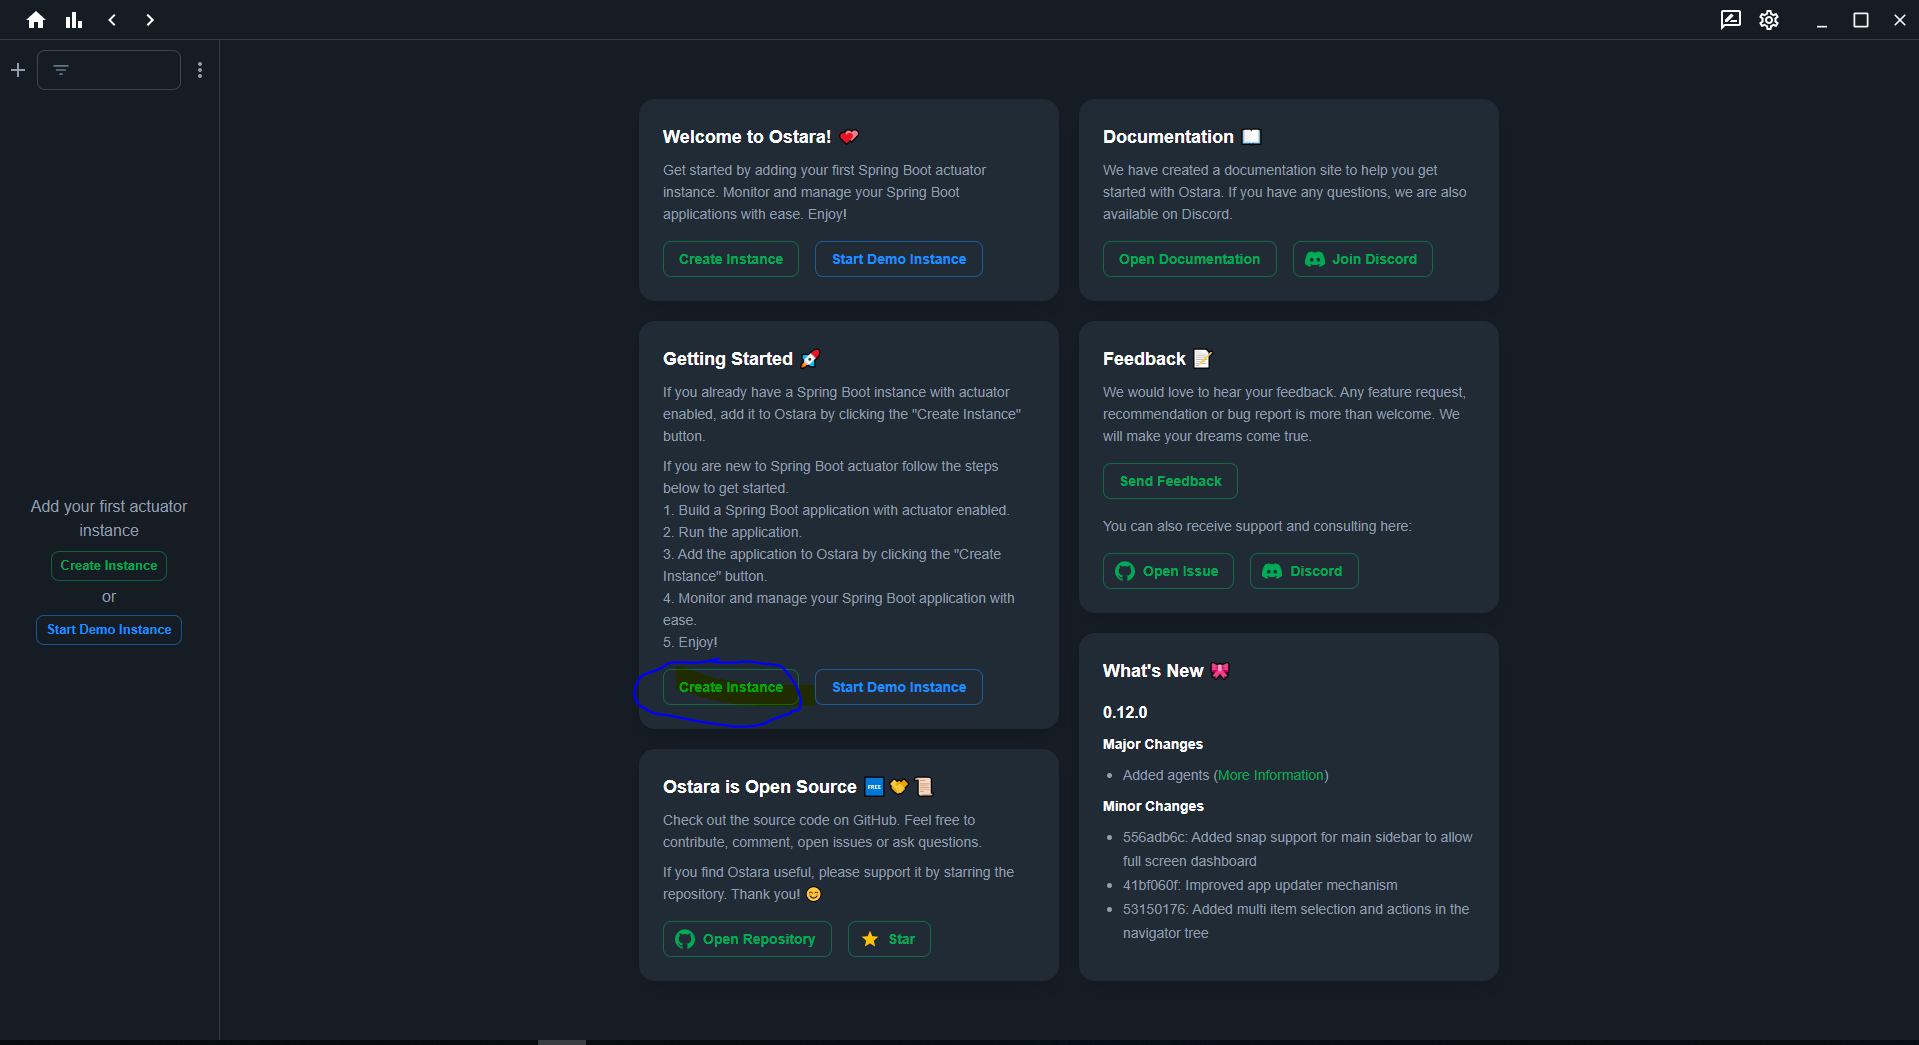
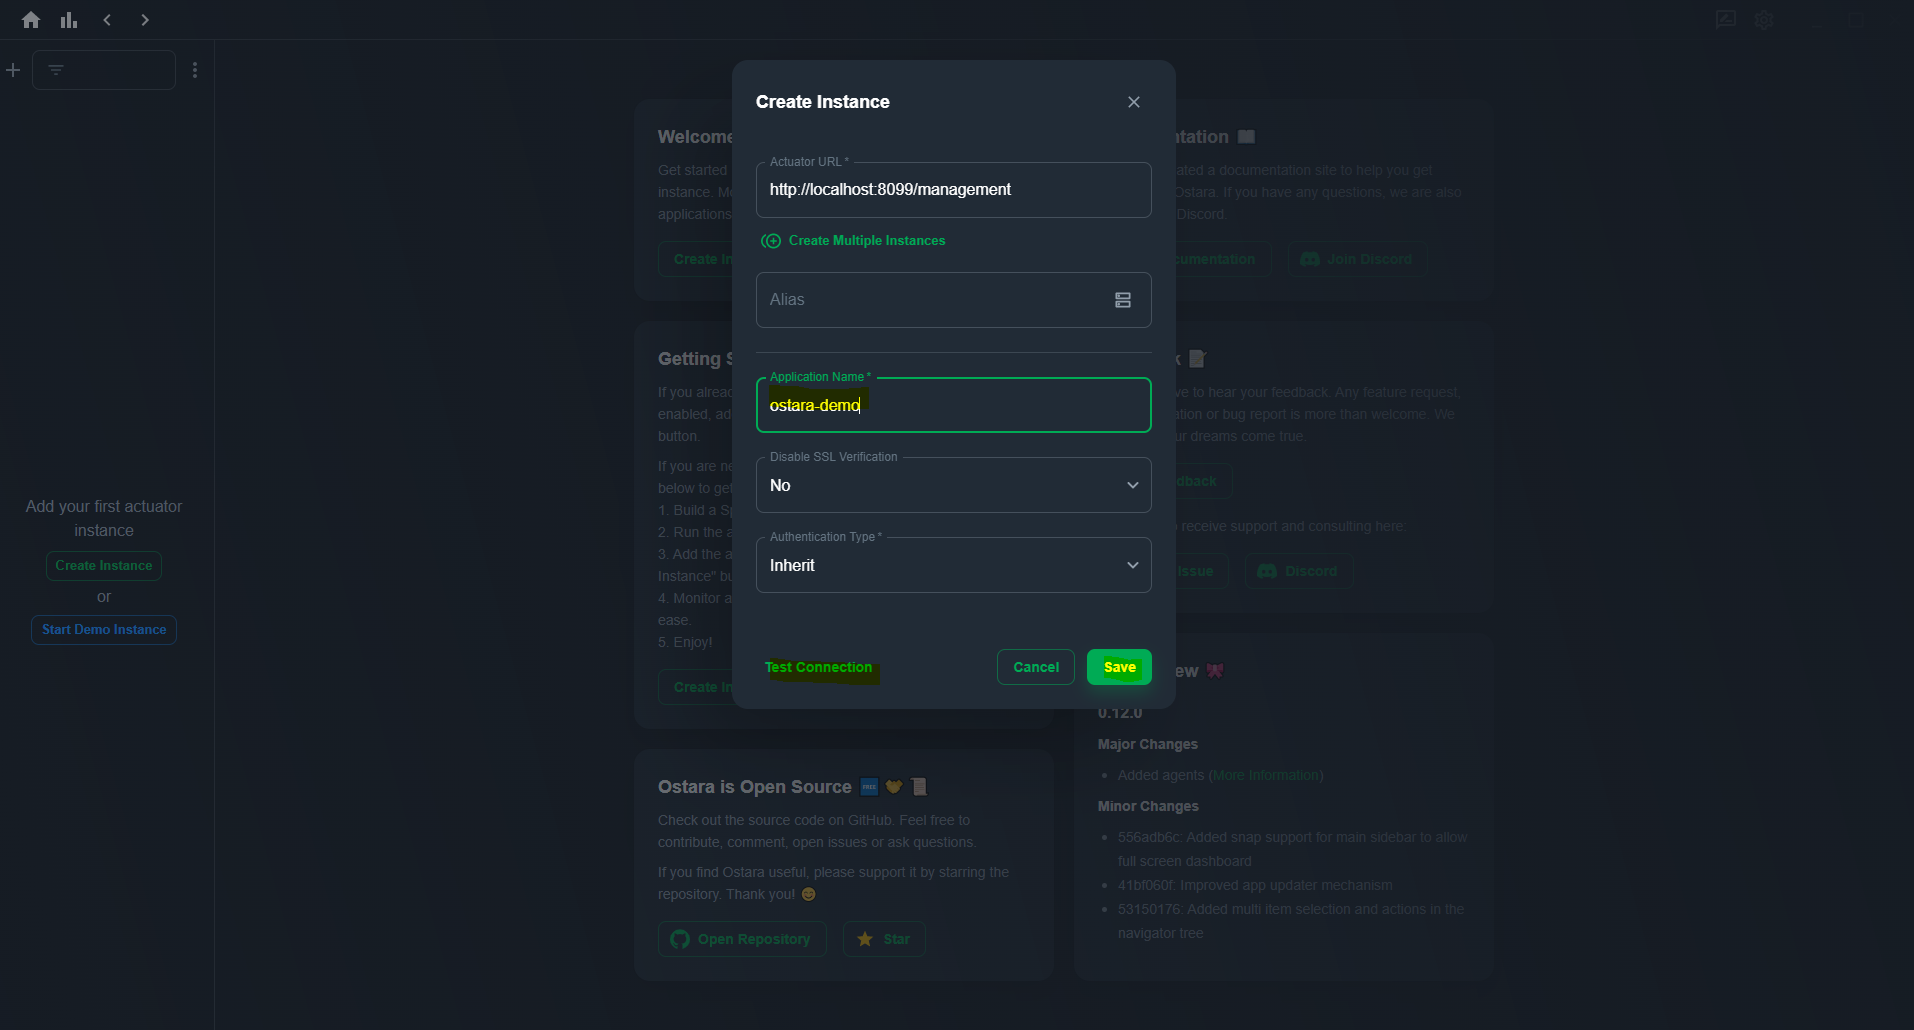
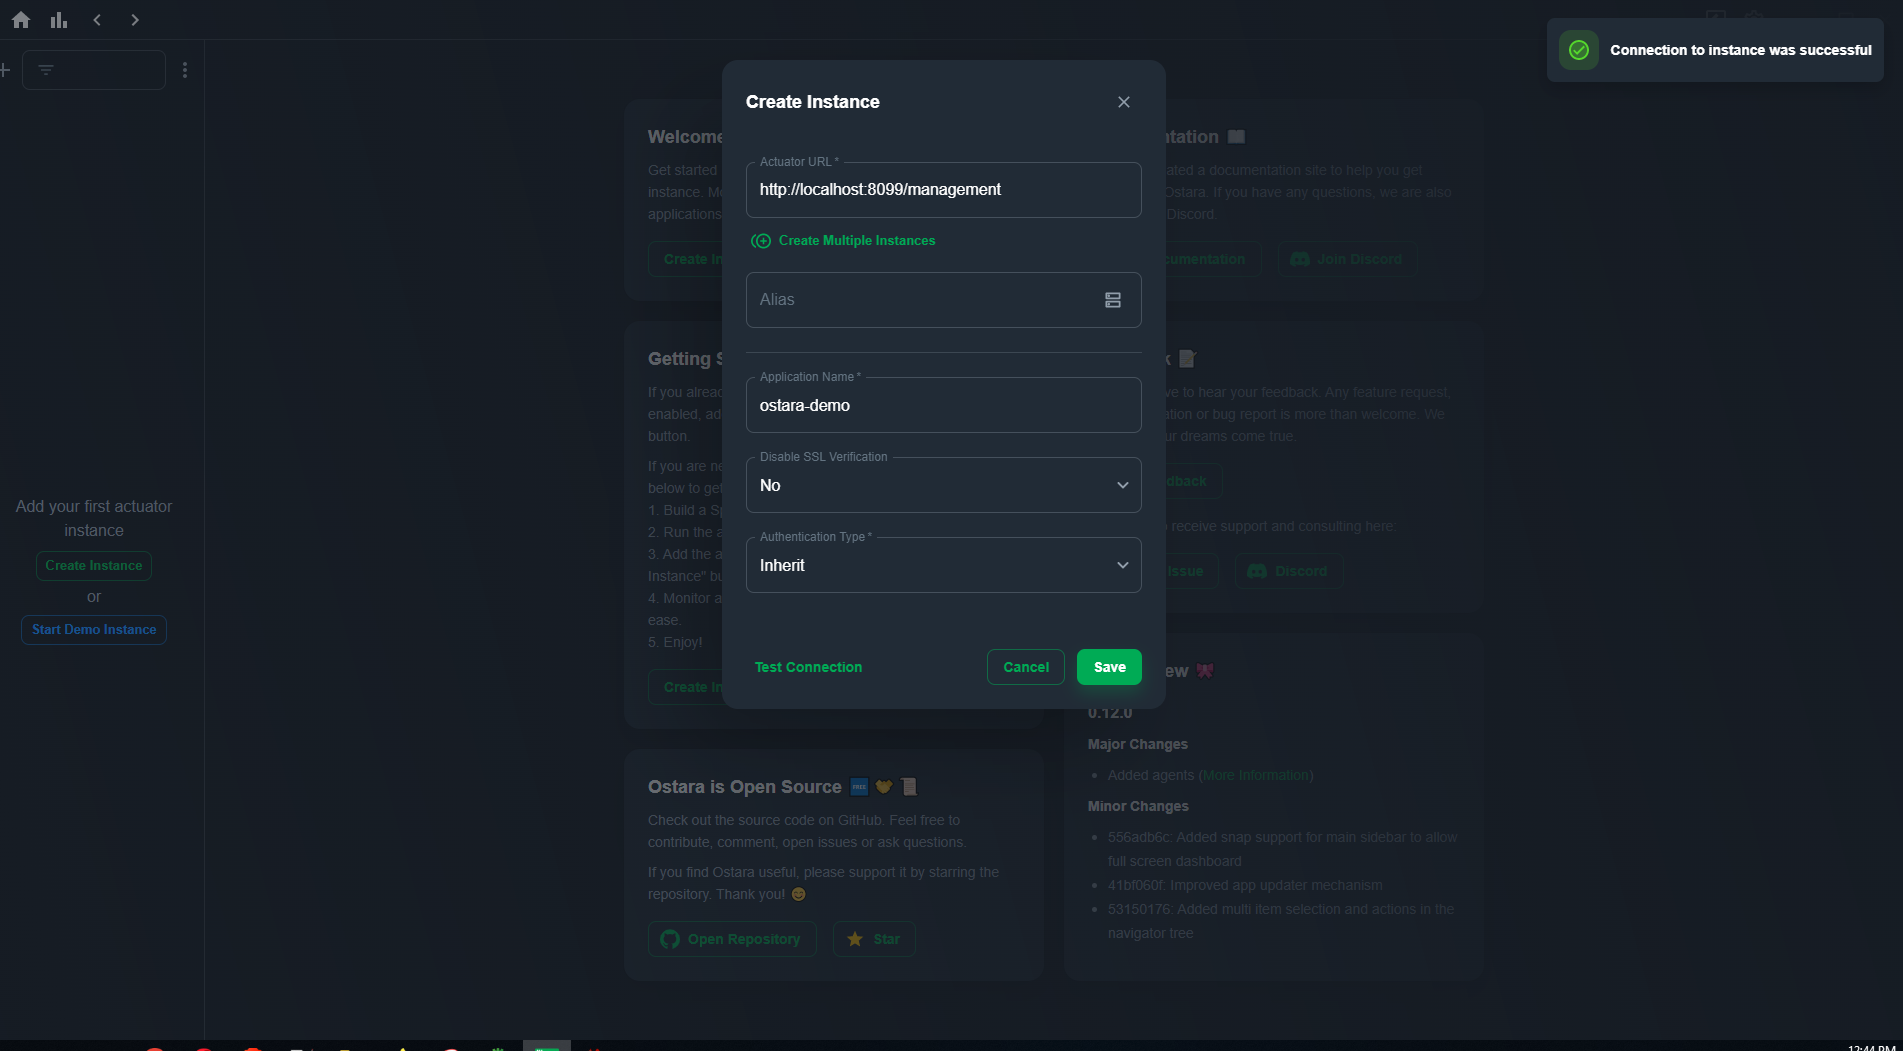
  • ⏱️ Fast Setup: Get started in 3 steps, no code or dependencies required. Download, add app URL, and enjoy!
  • Deep Insights: Analyze metrics, beans graph, thread dumps, and customize UI with icons & colors.
  • Organize & Group: Group apps by environment and access app properties directly.
  • Proactive Alerts: Configure notifications for metrics to avoid service degradation or downtime.
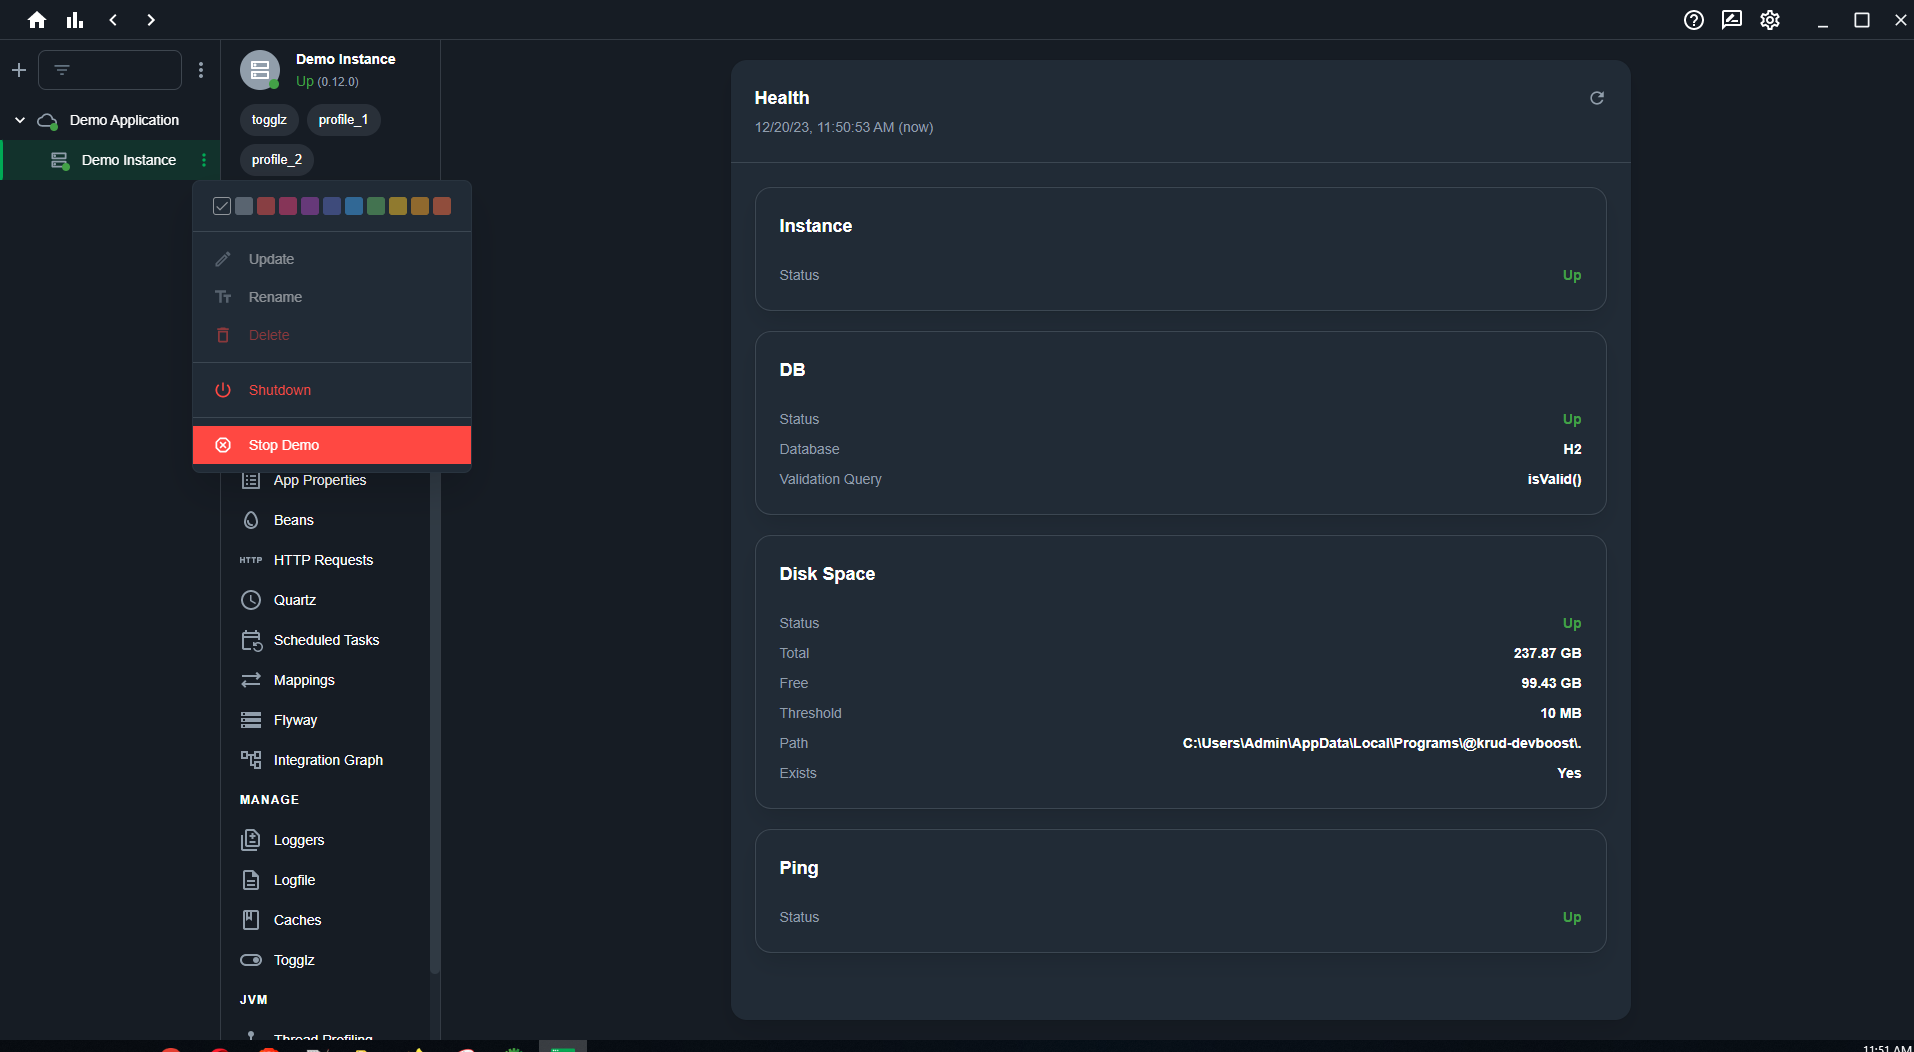
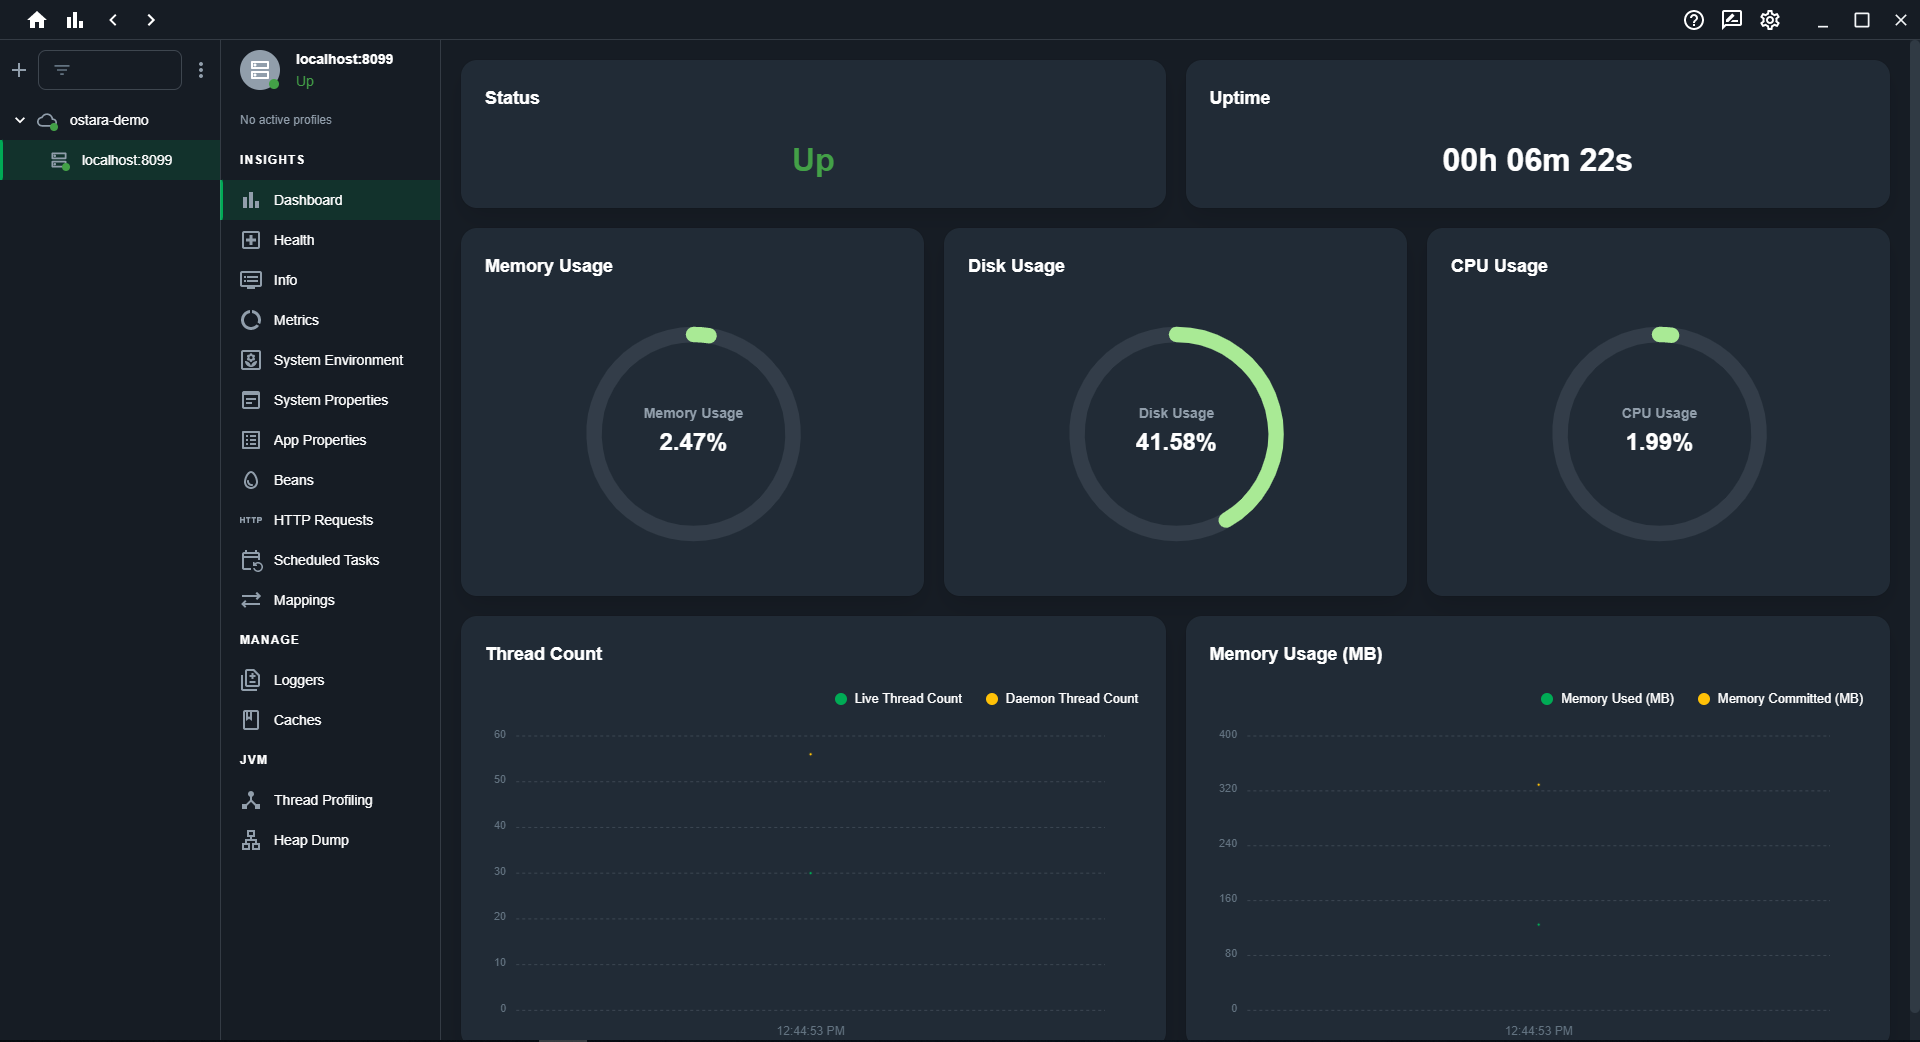
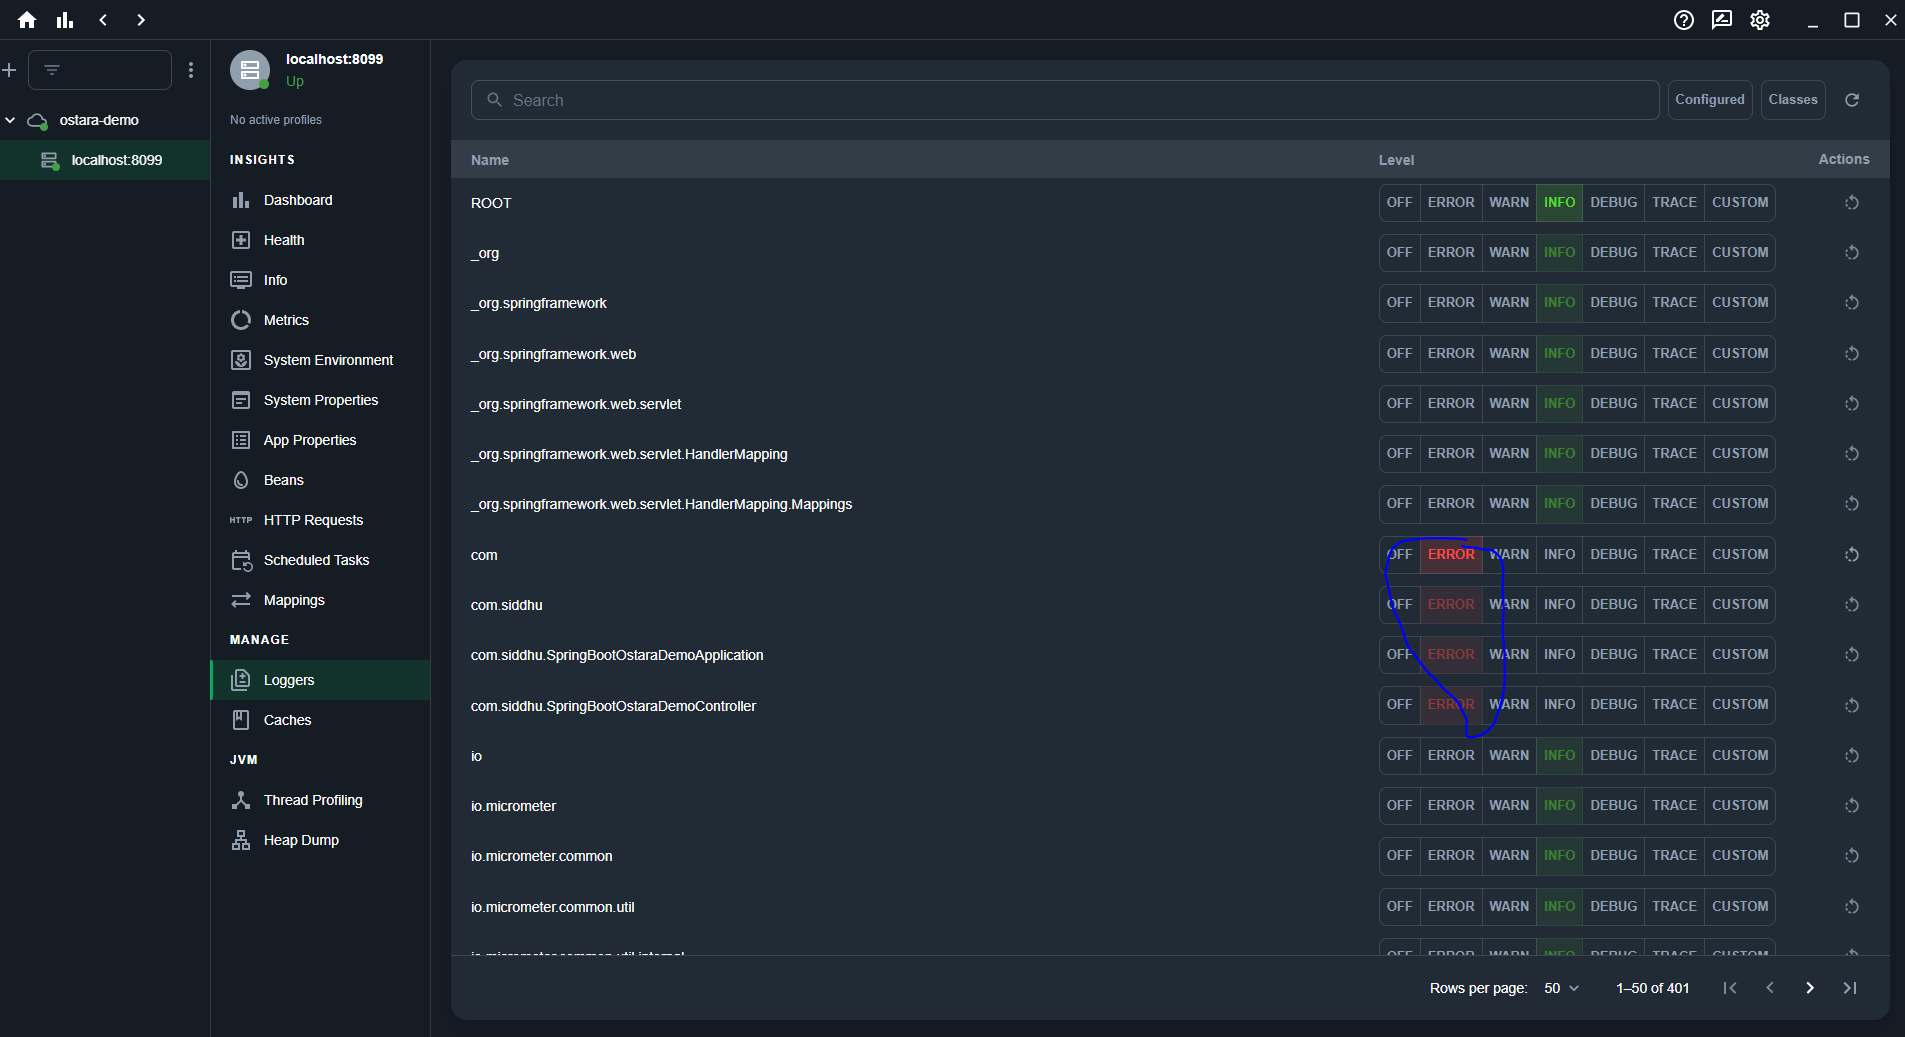
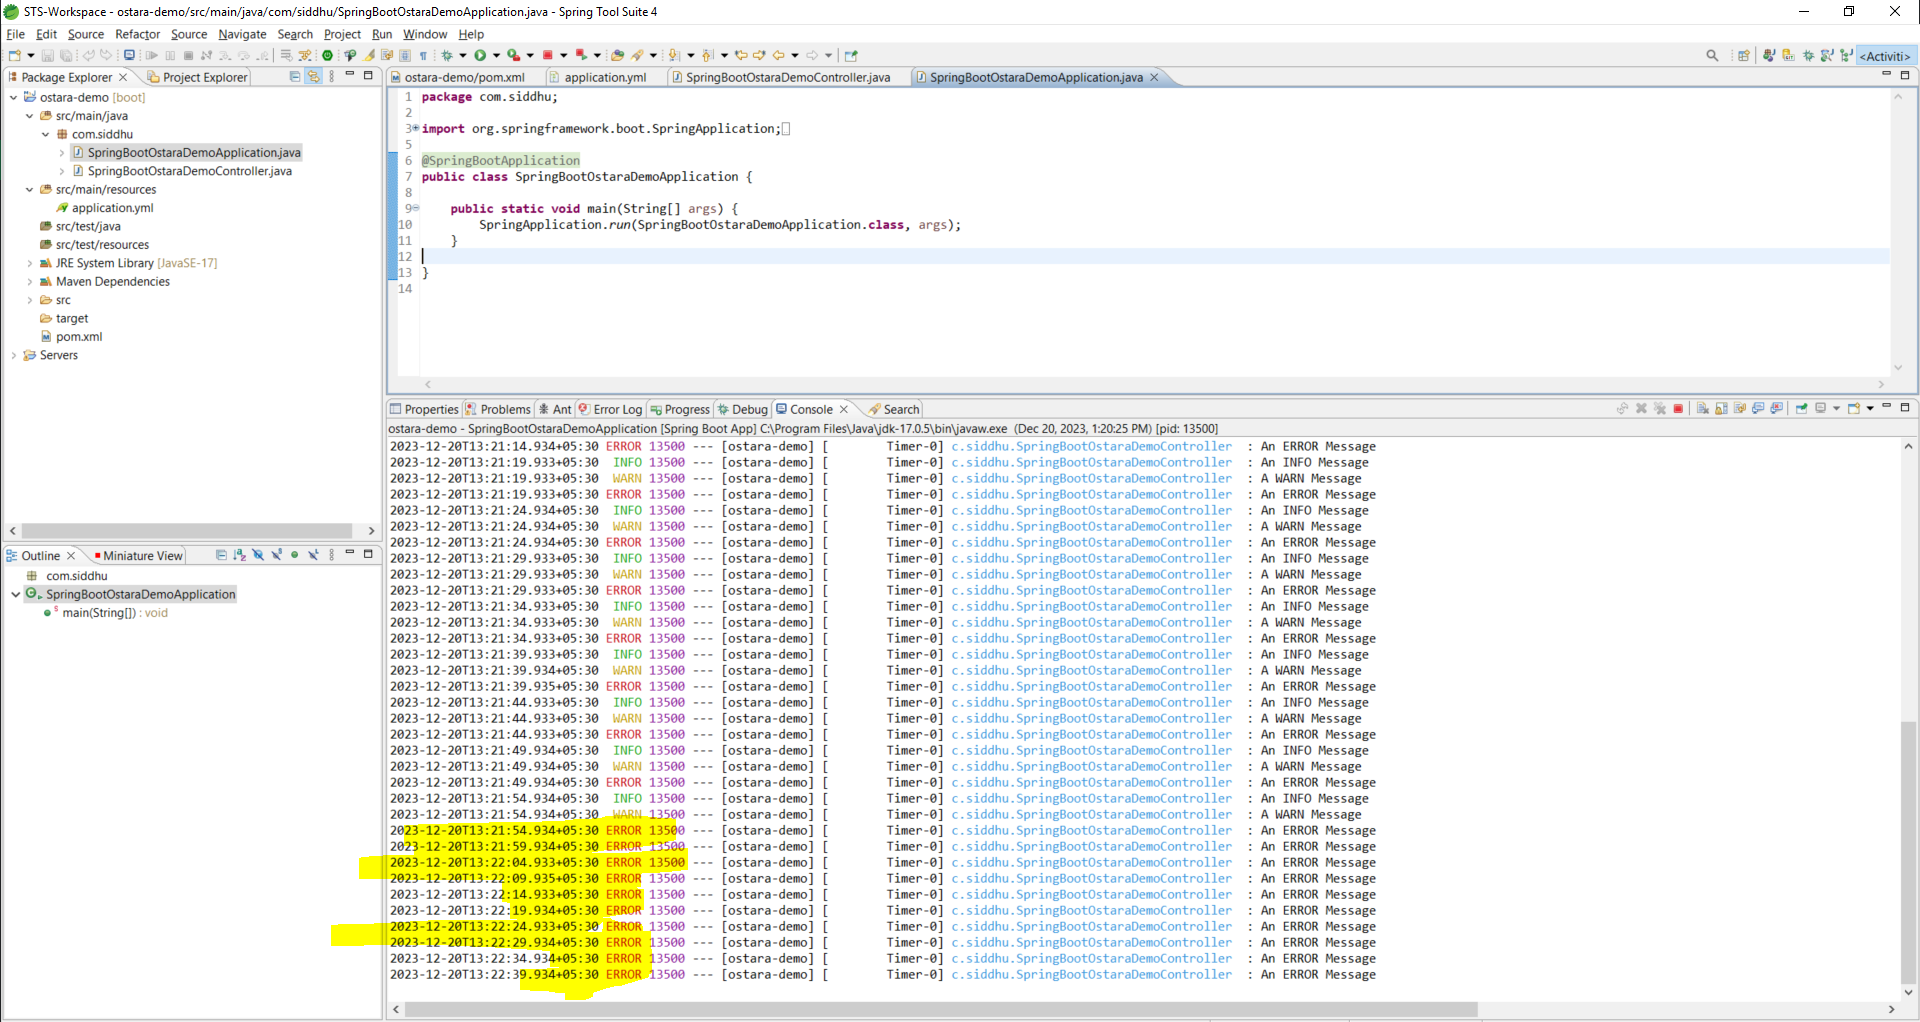
  • 🪵 Log Access & Analysis: Stream & download log files conveniently.
  • ❓ Easy to Use: Spring Boot Admin alternative with clear docs and FAQs.
  • Improves Workflow: Set up in 2 minutes and boost your daily work (it’s free!).
  • ️ Future Roadmap: Check out planned features and request new ones!
  • Free Spring Boot helper app: Manage and track your Spring Boot apps without hassle.
  • See what’s happening live: Monitor health, logs, and more to catch problems fast.
  • Easy control panel: Change settings, clear caches, and more with a few clicks.
  • Get started in a flash: Download, add your app, and you’re good to go in minutes.
  • Dive deeper: Analyze data, explore connections, and personalize your view.
  • Keep things organized: Group apps and access settings all in one place.
  • Get early warnings: Set up alerts to stay ahead of any issues.
  • Check logs easily: Stream or download logs for quick troubleshooting.
  • Simple to use: Clear docs and FAQs make it a breeze to learn.
  • Boost your workflow: Save time and effort with this free tool.
  • Look ahead: See what new features are coming and suggest your own!

Now question is why to use Ostara and the reasons are follows:-

  • Existing tools like Spring Boot Admin are great, but not plug-and-play.
  • Implementing Spring Boot Admin involves creating and maintaining both server and client components.
  • Adding features to Spring Boot Admin requires customization and potential complexity.
  • Pre-built Spring Boot Admin images lack production-readiness and may be outdated.
  • Integrating Spring Boot Admin with Spring Security adds configuration burden.
  • Using Spring Cloud Discovery for instance discovery adds another layer of complexity.

Now lets try to deploy Ostara and play with its feature. As we are using windows machine you can download the latest version of Ostara from below location.

https://github.com/krud-dev/ostara/releases/download/v0.12.0/Ostara-Setup-0.12.0.exe

Install the softare and you will be able to get the below screen.

click on Start Demo Screen and you will be able to open the inbuild demo apps of Ostara already integrated with Springboot application. To know the feature you can play with it on refer to the documents given in below locations.

https://docs.ostara.dev/

Now lets create our first Springboot application and configure Ostara in it.

Create a springboot application using below screen

Now add Spring actuator dependencies as ostara listen/consume to the actuator endpoints. Additional add JDK version we want to use and also the plugin in the pom.xml.

1- Pom.xml

1
2
3
4
5
6
7
8
9
10
11
12
13
14
15
16
17
18
19
20
21
22
23
24
25
26
27
28
29
30
31
32
33
34
35
36
37
38
39
40
  <modelVersion>4.0.0</modelVersion>
  <parent>
    <groupId>org.springframework.boot</groupId>
    <artifactId>spring-boot-starter-parent</artifactId>
    <version>3.2.0</version>
  </parent>
  <groupId>com.siddhu</groupId>
  <artifactId>ostara-demo</artifactId>
  <version>0.0.1-SNAPSHOT</version>
  <name>ostara-demo</name>
  <description>Integration of Ostara with Springboot application.</description>
  <properties>
        <java.version>17</java.version>
    </properties>
  <dependencies>
        <dependency>
            <groupId>org.springframework.boot</groupId>
            <artifactId>spring-boot-starter-actuator</artifactId>
        </dependency>
        <dependency>
            <groupId>org.springframework.boot</groupId>
            <artifactId>spring-boot-starter-web</artifactId>
        </dependency>
 
        <dependency>
            <groupId>org.springframework.boot</groupId>
            <artifactId>spring-boot-starter-test</artifactId>
            <scope>test</scope>
        </dependency>
    </dependencies>
    <build>
        <plugins>
            <plugin>
                <groupId>org.springframework.boot</groupId>
                <artifactId>spring-boot-maven-plugin</artifactId>
            </plugin>
        </plugins>
    </build>
</project>

Now lets create an application.yml file and add following code init.
To use Ostara we must have a running and accessible Spring Boot application with Actuator Web API. By default all web endpoints are not exposed, we need to enable them.

1
2
3
4
5
6
7
8
9
10
11
12
management:
  endpoints:
    web:
      base-path: /management
      exposure:
        include: '*'
  endpoint:
    health:
      show-details: always
  info:
    env:
      enabled: true

Additional we had added few of the parameter specific to Ostara in applicaiton.yml.

1
2
3
4
5
6
7
8
9
10
# INFO ENDPOINT CONFIGURATION
info:
  app:
   name: '@project.name@'
   description: '@project.description@'
   version: "@project.version@"
   build-date: '@maven.build.timestamp@'
   encoding: "@project.build.sourceEncoding@"
   java:
    version: "@java.version@"

2- applicaiton.yml

1
2
3
4
5
6
7
8
9
10
11
12
13
14
15
16
17
18
19
20
21
22
23
24
25
26
27
28
29
30
31
32
33
34
35
36
server:
  port: 8099
 
spring:
  application:
    name: ostara-demo
  jackson:
    default-property-inclusion: NON_NULL
    serialization:
      fail-on-empty-beans: false
  main:
    allow-bean-definition-overriding: true
 
# INFO ENDPOINT CONFIGURATION
info:
  app:
   name: '@project.name@'
   description: '@project.description@'
   version: "@project.version@"
   build-date: '@maven.build.timestamp@'
   encoding: "@project.build.sourceEncoding@"
   java:
    version: "@java.version@"
 
management:
  endpoints:
    web:
      base-path: /management
      exposure:
        include: '*'
  endpoint:
    health:
      show-details: always
  info:
    env:
      enabled: true

Finally create out our controller and springboot application class.

1- SpringBootOstaraDemoApplication

1
2
3
4
5
6
7
8
9
10
11
12
13
package com.siddhu;
 
import org.springframework.boot.SpringApplication;
import org.springframework.boot.autoconfigure.SpringBootApplication;
 
@SpringBootApplication
public class SpringBootOstaraDemoApplication {
 
    public static void main(String[] args) {
        SpringApplication.run(SpringBootOstaraDemoApplication.class, args);
    }
 
}

2- SpringBootOstaraDemoController

1
2
3
4
5
6
7
8
9
10
11
12
13
package com.siddhu;
 
import org.springframework.web.bind.annotation.GetMapping;
import org.springframework.web.bind.annotation.RestController;
 
@RestController
public class SpringBootOstaraDemoController {
 
    @GetMapping("/ostarametrics")
    public String getMetricDemo() {
        return "Ostara Configured properly";
    }
}

Now finally run the application

Check if the actuator end point are exposed properly.

Now once the Ostara desktop is ready, add an instance by clicking Create Instance and add following information

Actuator URL: (It’s the URL for the actuator.) In this case http://localhost:8099/management
Alias: (Instance alias name)
Application Name: (application name)
Disable SSL Verification: Yes or NO
Authentication Type: (if Actuator endpoints are protected)

Now lets try to add few of the method and check if our ostara is running properly we will add few of the logs type i.e. warning, info , error and check if we are able to see its impact at run time.

add following method in our controller.

1
2
3
4
5
6
7
8
9
10
11
12
13
14
15
public void callLogMethod()
    {
        int delay = 0; // delay for x minutes
        int period = 5 * 1000; // repeat every x minutes
 
        Timer timer = new Timer();
 
        timer.scheduleAtFixedRate(new TimerTask() {
            public void run() {
                // put your task here
                allLog();
                //System.out.println("Task "+ logType + " on " + new java.util.Date());
            }
        }, delay, period);
    }

this method will call method allLog() every 5 sec and in this allLog() add all type of log i.e.

1
2
3
4
5
6
7
8
public void allLog()
   {
       logger.trace("A TRACE Message");
       logger.debug("A DEBUG Message");
       logger.info("An INFO Message");
       logger.warn("A WARN Message");
       logger.error("An ERROR Message");
   }

so when we change the type of log in ostara ui we will be able to check only that log will be displayed on the screen.

Start application and hit below url

http://localhost:8099/ostarametrics

as shown above now all logs are shown lets change only to error using ostara ui.

Now see we only see the error log on the prompt.

## Ostara FOSS Admin App for Spring Boot: Key Facts

* **Free and open-source admin app for managing Spring Boot apps and microservices.**

* **Simplifies monitoring, control, and analysis of your Spring Boot apps.**

* **Key features:**

    * Real-time monitoring of health, logs, and metrics.

    * Easy management of settings, logs, caches, and threads.

    * Fast setup with no code or dependencies required.

    * Deep insights and customization with data analysis, graph exploration, and UI personalization.

    * Organized app grouping and access to settings in one place.

    * Proactive alerts to prevent service degradation or downtime.

    * Log access and analysis with streaming and download options.

    * Easy to use with clear documentation and FAQs.

    * Improves workflow with quick setup and time-saving features.

    * Future roadmap with exciting planned features and open to suggestions.

* **Benefits of using Ostara:**

    * Avoids the tangled mess of Spring Boot app management.

    * Easier than existing tools like Spring Boot Admin.

    * No need for server and client components or complex customization.

    * Production-ready and readily available.

    * Simple integration with Spring Security and Spring Cloud Discovery.

* **Getting started:**

    * Download Ostara Setup for your platform.

    * Start the demo to explore pre-built Spring Boot apps with Ostara integration.

    * Create your own Spring Boot app and configure Ostara with actuator dependencies.

    * Use application.yml to configure Ostara access and information.

    * Run your Spring Boot app and access Ostara features.

## Key Takeaways:

* **Ostara is a free and open-source admin app for managing Spring Boot apps and microservices.**

* **It simplifies monitoring, control, and analysis of your apps, making it easier to keep them healthy and running smoothly.**

* **Some of its key features include real-time monitoring, effortless control panel, instant setup, deep insights, organized app grouping, proactive alerts, and log access & analysis.**

* **Compared to existing tools like Spring Boot Admin, Ostara is:

    * Easier to use with no server or client components required.

    * Faster to set up with no code or dependencies needed.

    * More production-ready and readily available.**

* **Getting started with Ostara is simple: download the app, add your app URL, and start monitoring.**

Source Code:- https://github.com/shdhumale/ostara-demo

HASHTAGS:

springboot #micorservices #ostara #freeadmintool #monitoring #appmanagement #devops #productivity #opensource #cloudnative