As I am using Window machine and minikube was showing me 100% cpu utilization so i had used inbuild kubernetes from docker desktop with below configuations.

- Configure EFK stack manually
Step 1: Create a Namespace
kubectl get namespaces
kubectl create -f siddhu-kube-logging.yaml
Step 2: Setup Elasticsearch
kubectl create -f siddhu-elastic-stack.yaml
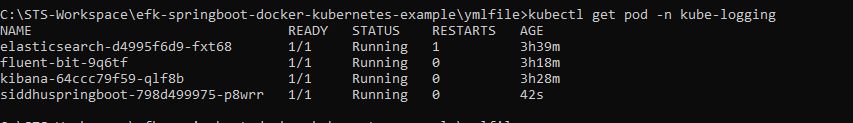
kubectl get pod -n kube-logging
kubectl describe pod -n kube-logging
kubectl get pod -n kube-logging -o wide
kubectl port-forward 9200:9200 -n kube-logging
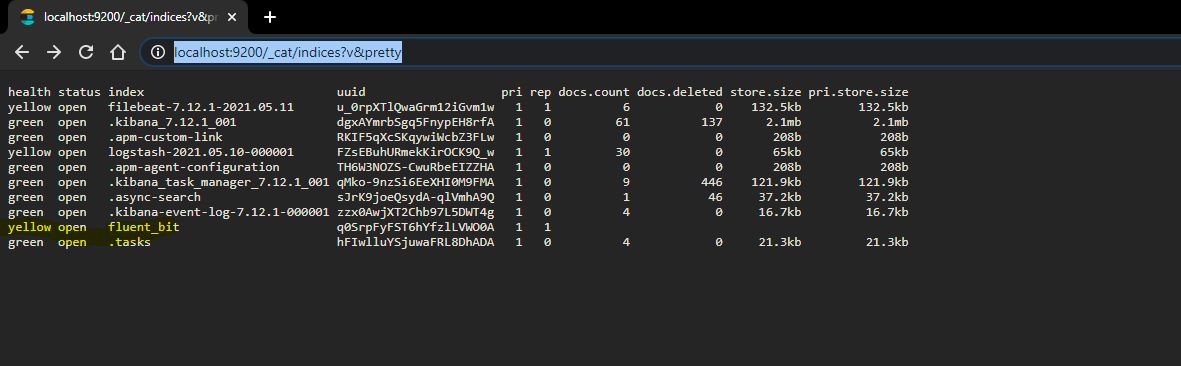
check this url is working http://localhost:9200
Step 3: Setup Kibana
kubectl create -f siddhu-kibana.yaml
kubectl port-forward 5601:5601 –namespace=kube-logging
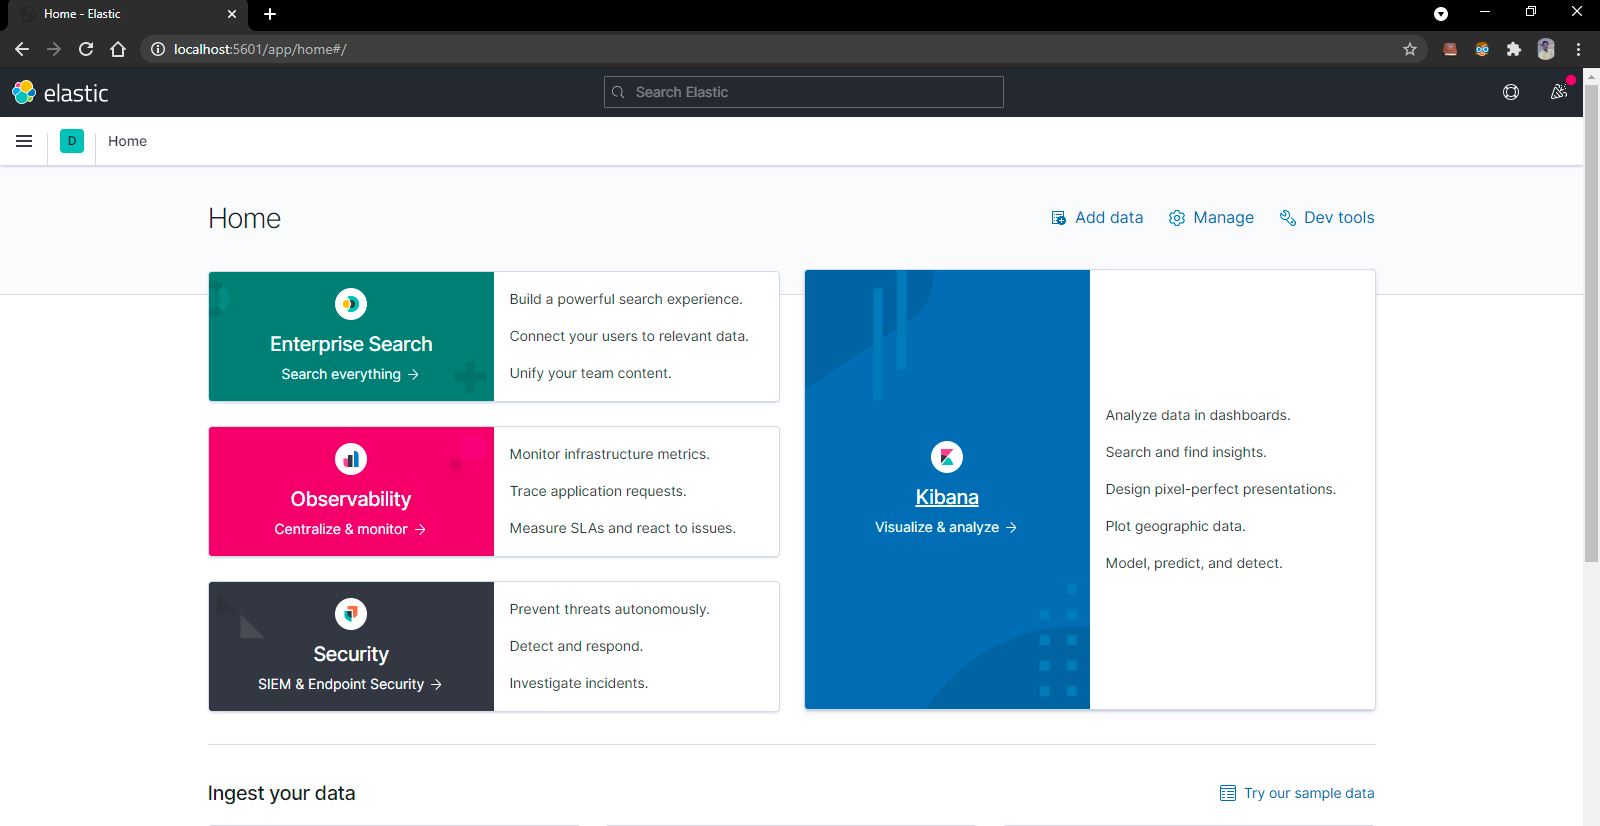
check this url is working http://localhost:5601
Step 4: Fluent Bit Service
kubectl create -f siddhu-fluent-bit-service-account.yaml
kubectl create -f siddhu-fluent-bit-role.yaml
kubectl create -f siddhu-fluent-bit-role-binding.yaml
kubectl create -f siddhu-fluent-bit-configmap.yaml
kubectl create -f siddhu-fluent-bit-ds.yaml
Note: All the files can be optained from below github locations.
https://github.com/shdhumale/efk-springboot-docker-kubernetes-example.git
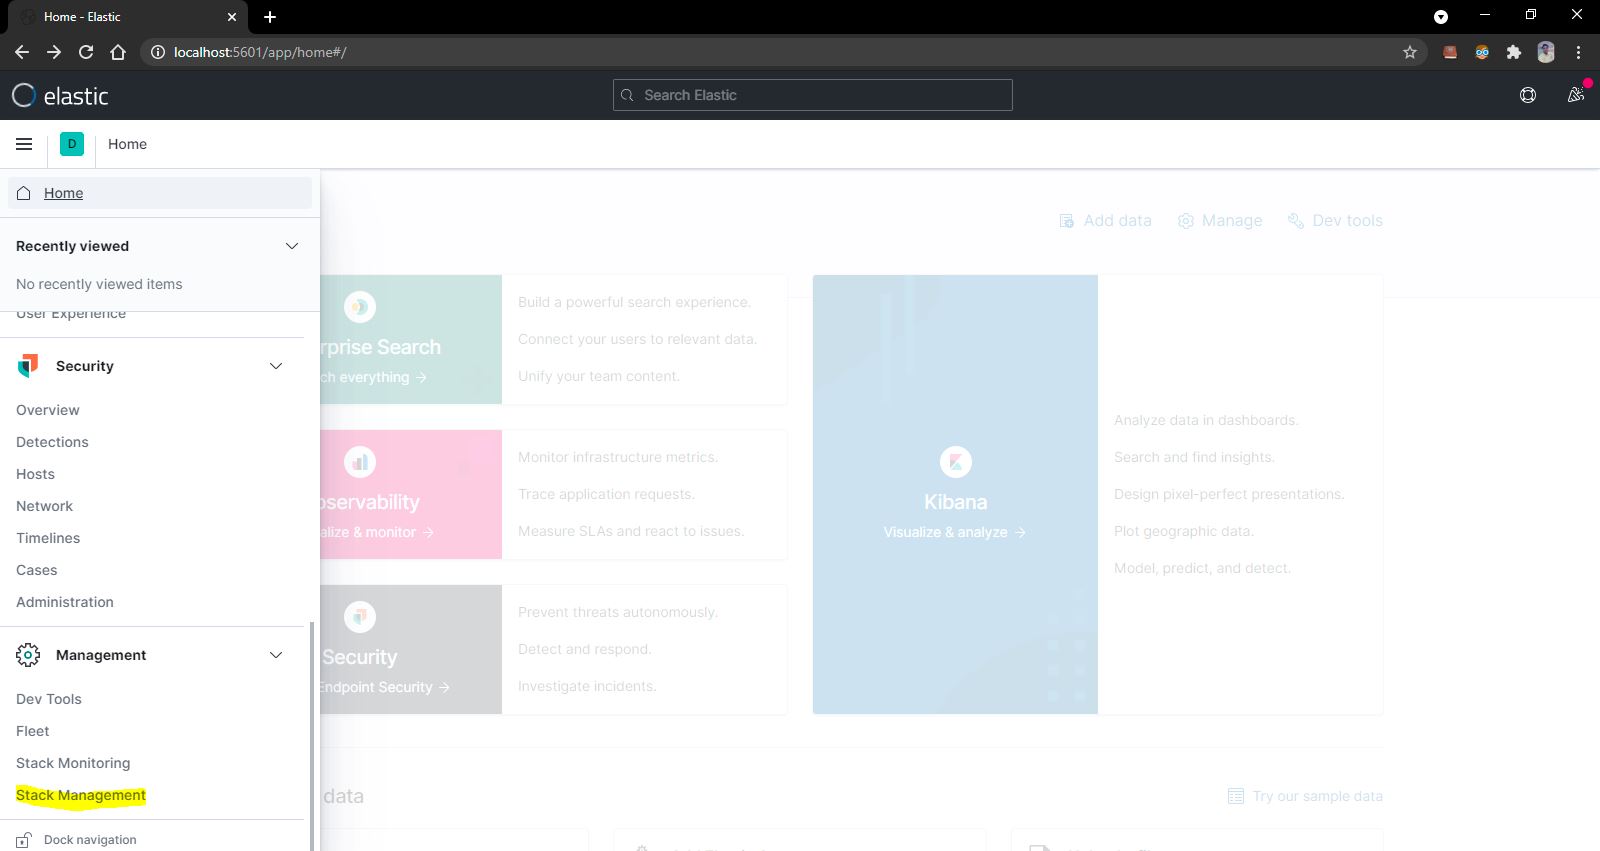
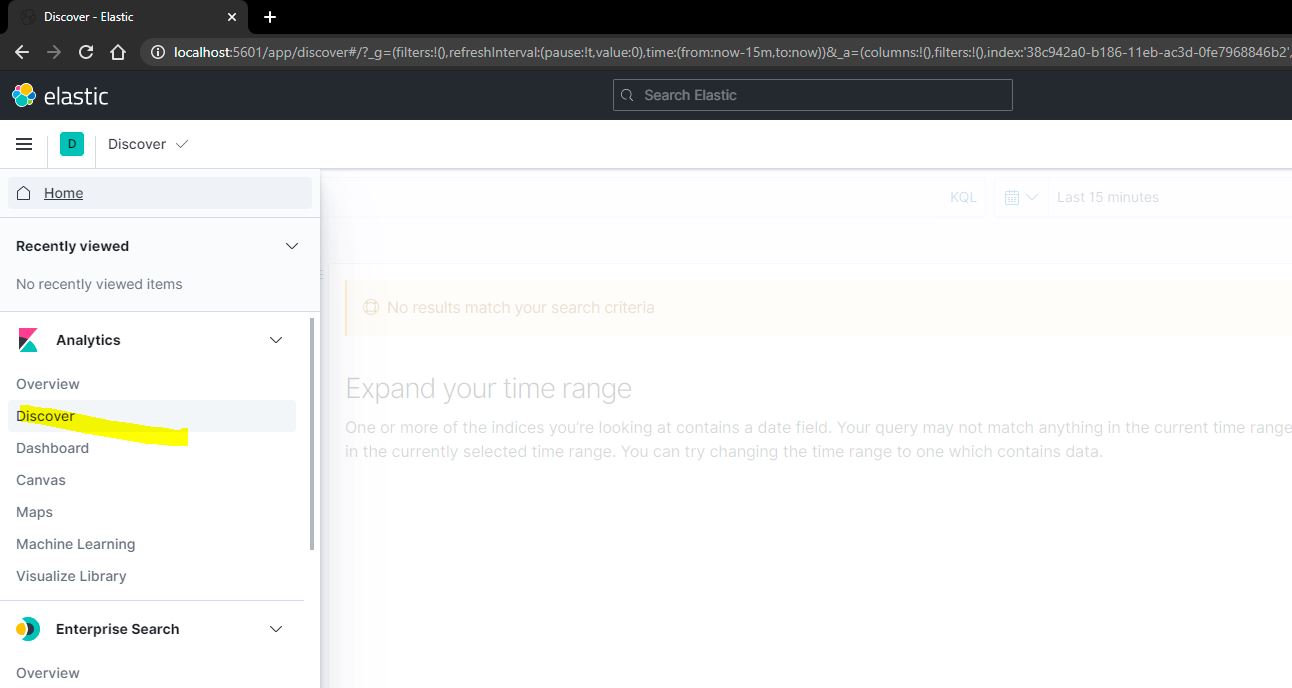
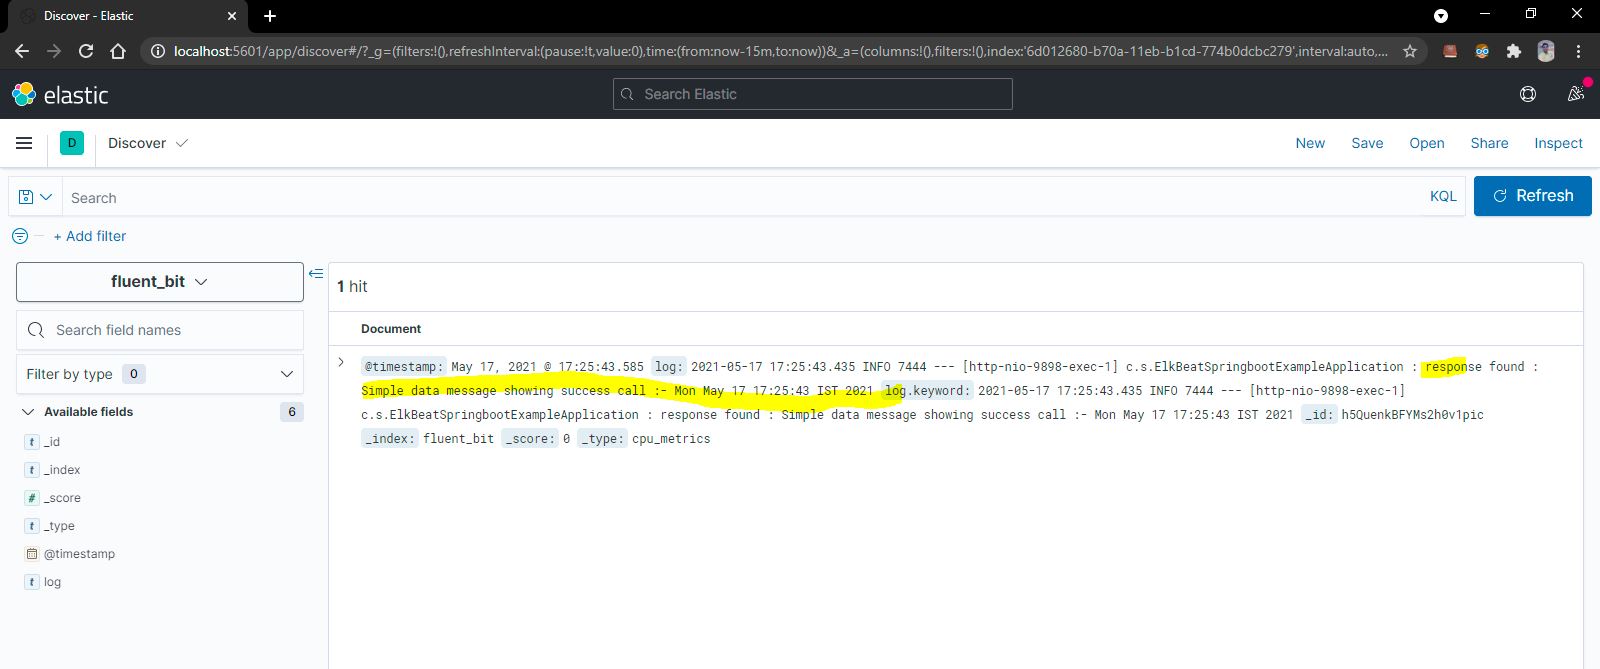
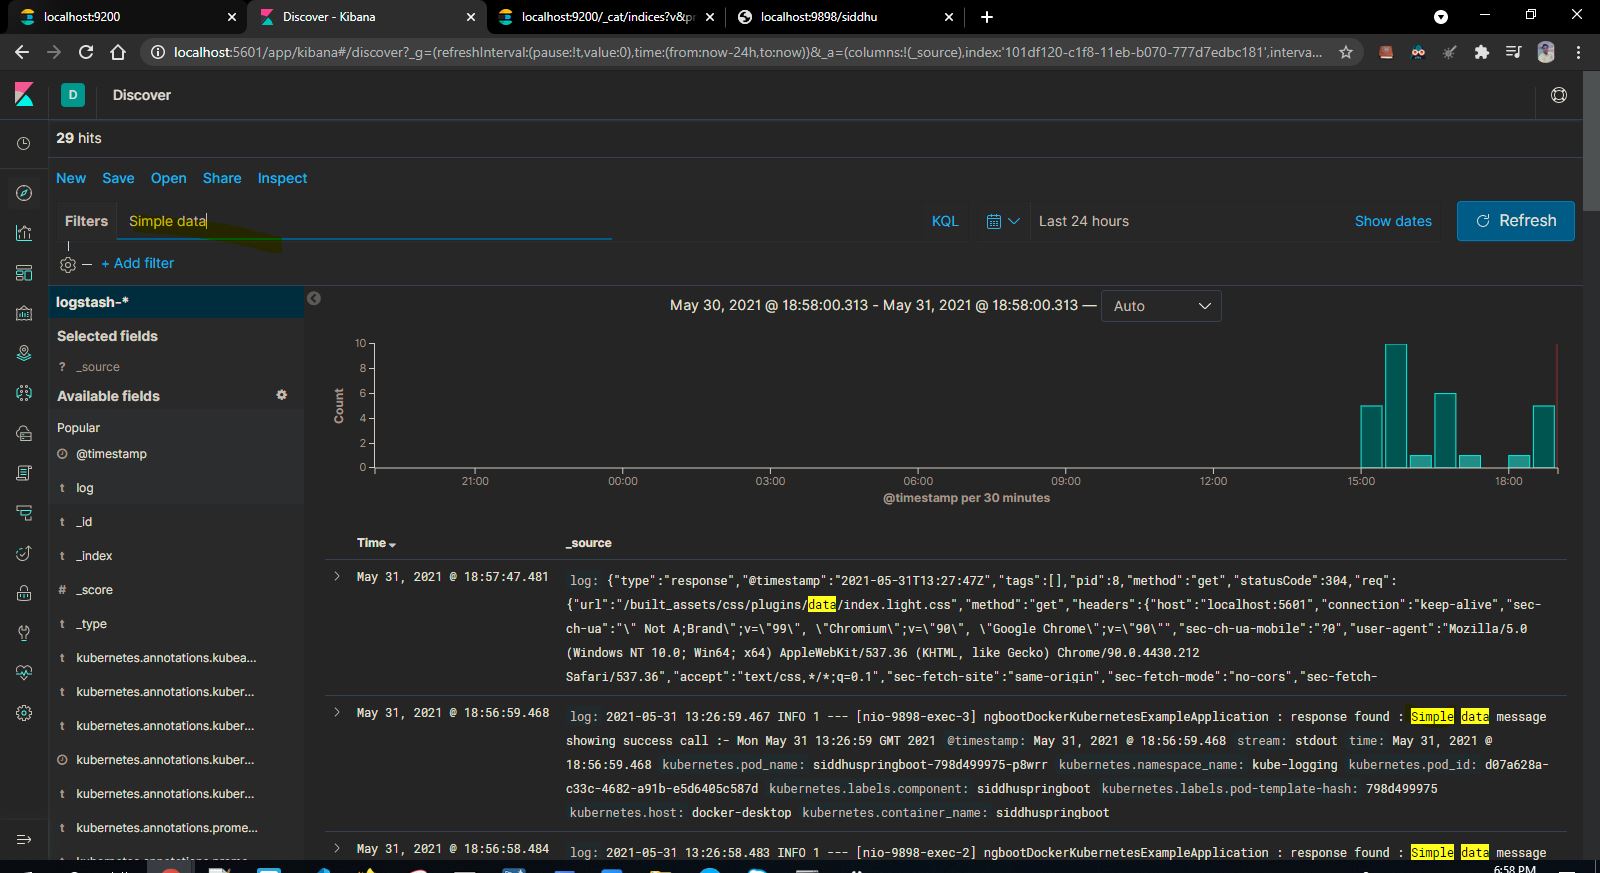
Finally access the logs of Kubernetes and Springboot application on Kibana UI screen
Now lets try to check the log created by our application spring boot applicaiton with EFK stack.
we are using VS Code as IDE for Springboot, Docker and Kubernetes.
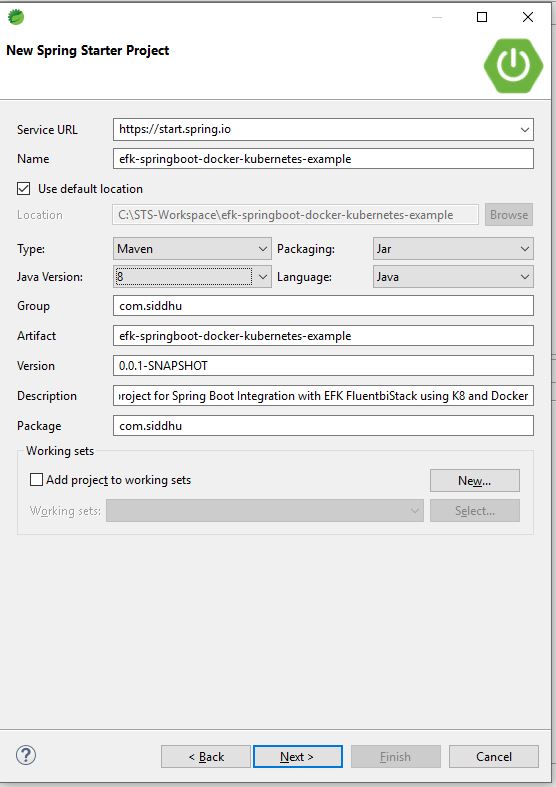
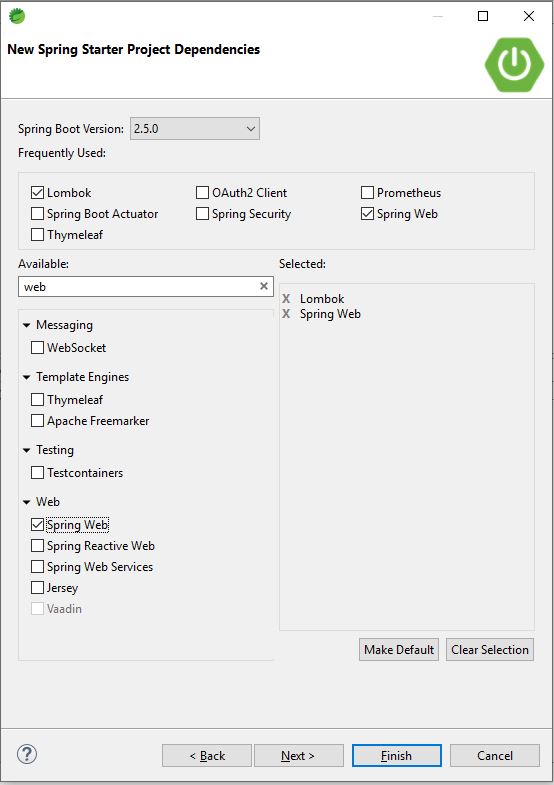
1- Create a springboot application.
Note:you can download the ready made spring maven project from the below location.

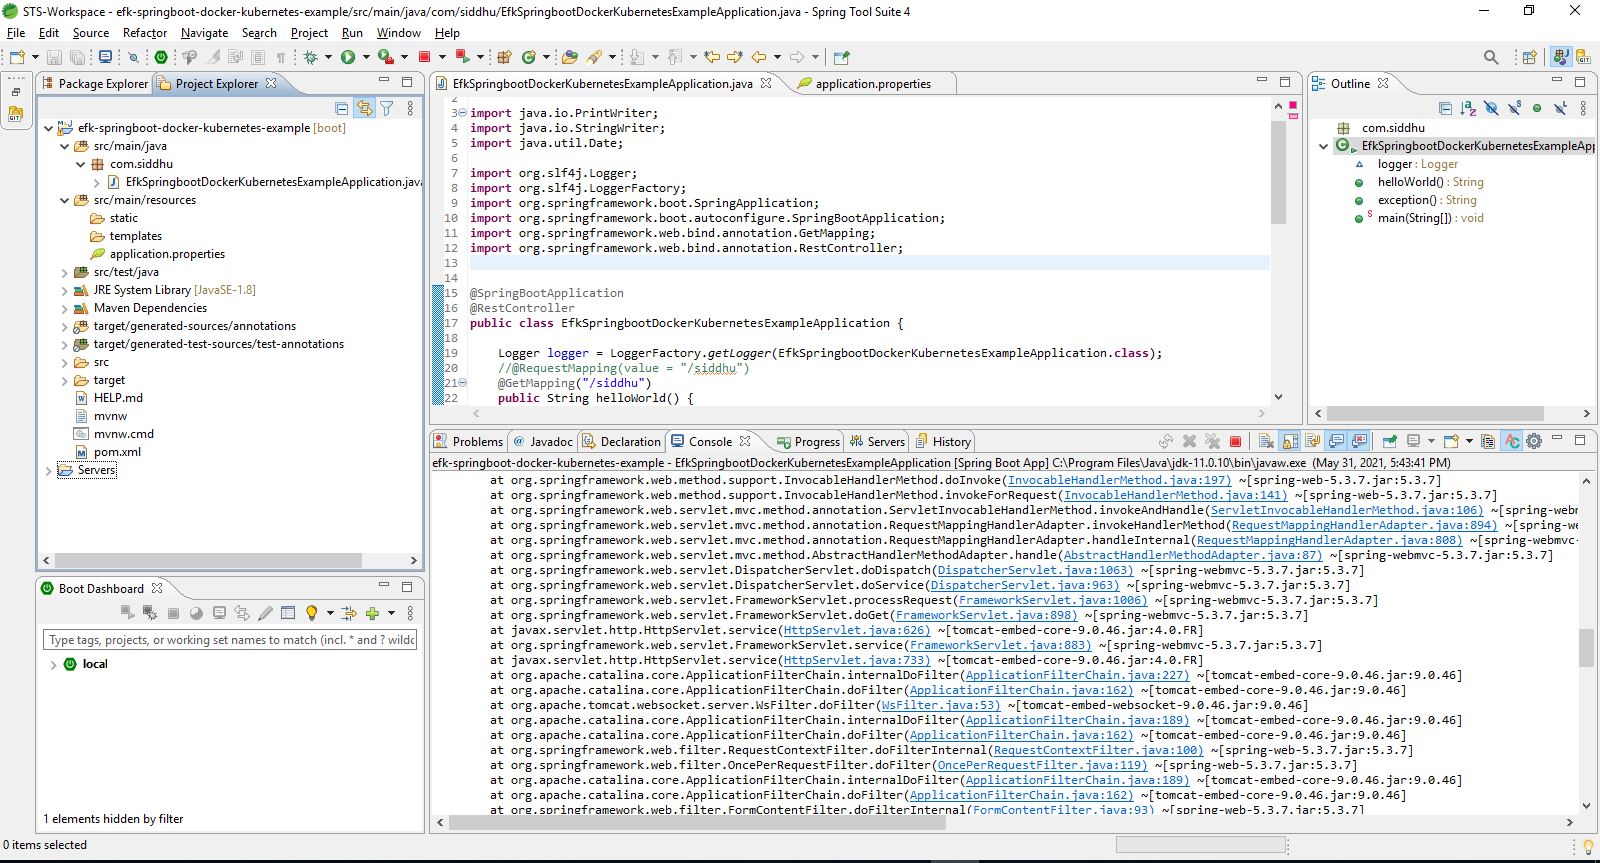
1- EfkSpringbootDockerKubernetesExampleApplication.java
package com.siddhu;
import java.io.PrintWriter;
import java.io.StringWriter;
import java.util.Date;
import org.slf4j.Logger;
import org.slf4j.LoggerFactory;
import org.springframework.boot.SpringApplication;
import org.springframework.boot.autoconfigure.SpringBootApplication;
import org.springframework.web.bind.annotation.GetMapping;
import org.springframework.web.bind.annotation.RestController;
@SpringBootApplication
@RestController
public class EfkSpringbootDockerKubernetesExampleApplication {
Logger logger = LoggerFactory.getLogger(EfkSpringbootDockerKubernetesExampleApplication.class);
//@RequestMapping(value = "/siddhu")
@GetMapping("/siddhu")
public String helloWorld() {
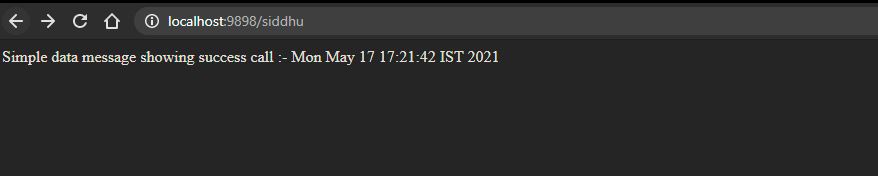
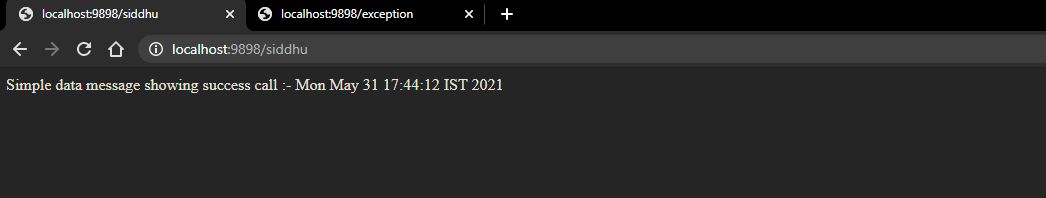
String response = "Simple data message showing success call :- " + new Date();
logger.info("response found : {}", response);
return response;
}
//@RequestMapping(value = "/exception")
@GetMapping("/exception")
public String exception() {
String response = "";
try {
throw new Exception("Displaying Exception :- ");
} catch (Exception e) {
e.printStackTrace();
logger.error("Exception Created:",e);
StringWriter sw = new StringWriter();
PrintWriter pw = new PrintWriter(sw);
e.printStackTrace(pw);
String stackTrace = sw.toString();
logger.error("Exception stackTrace- " + stackTrace);
response = stackTrace;
}
return response;
}
public static void main(String[] args) {
SpringApplication.run(EfkSpringbootDockerKubernetesExampleApplication.class, args);
}
}2- application.properties
spring.application.name=EFLK-Docker-Kubernetes-Example
server.port=9898
logging.file.name=C:/springboot-log/spring-boot-eflk.log
#logging.file.name= /var/log/containers/spring-boot-eflk.log
Try to build (clean install) and run the maven application and check it is creating the out put as needed.

2- Create a SpringBoot application Docker file
FROM java:8-jdk-alpine
COPY ./target/efk-springboot-docker-kubernetes-example-0.0.1-SNAPSHOT.jar /usr/app/
WORKDIR /usr/app
RUN sh -c 'touch efk-springboot-docker-kubernetes-example-0.0.1-SNAPSHOT.jar'
ENTRYPOINT ["java","-jar","efk-springboot-docker-kubernetes-example-0.0.1-SNAPSHOT.jar"]
3- Create a SpringBoot application Docker Image
Note Before making docker image change the log files line in application.properties as shown below.
logging.file.name= /var/log/containers/spring-boot-eflk.log
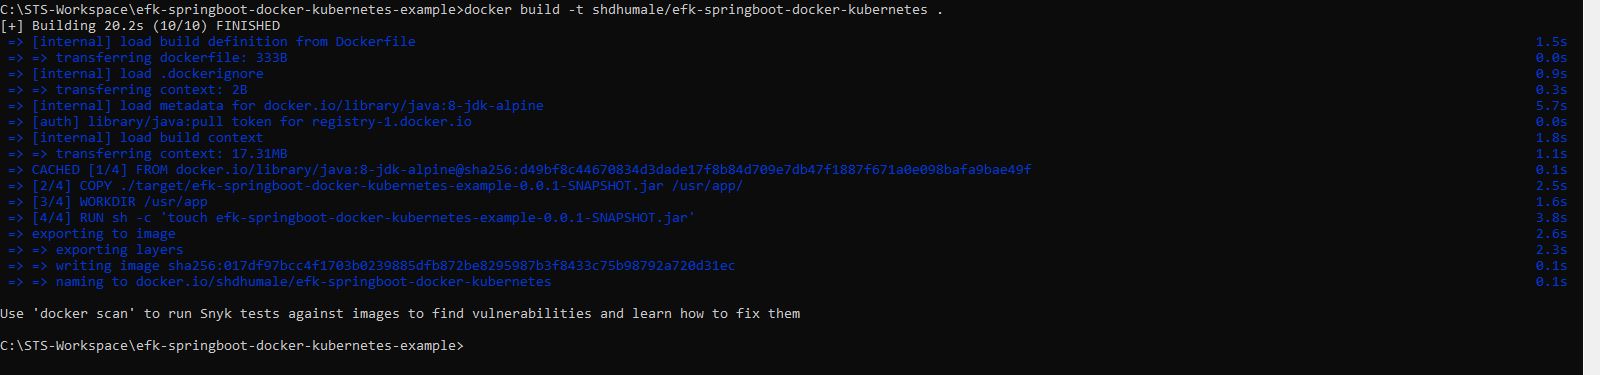
Now execute below command
docker build -t shdhumale/efk-springboot-docker-kubernetes .
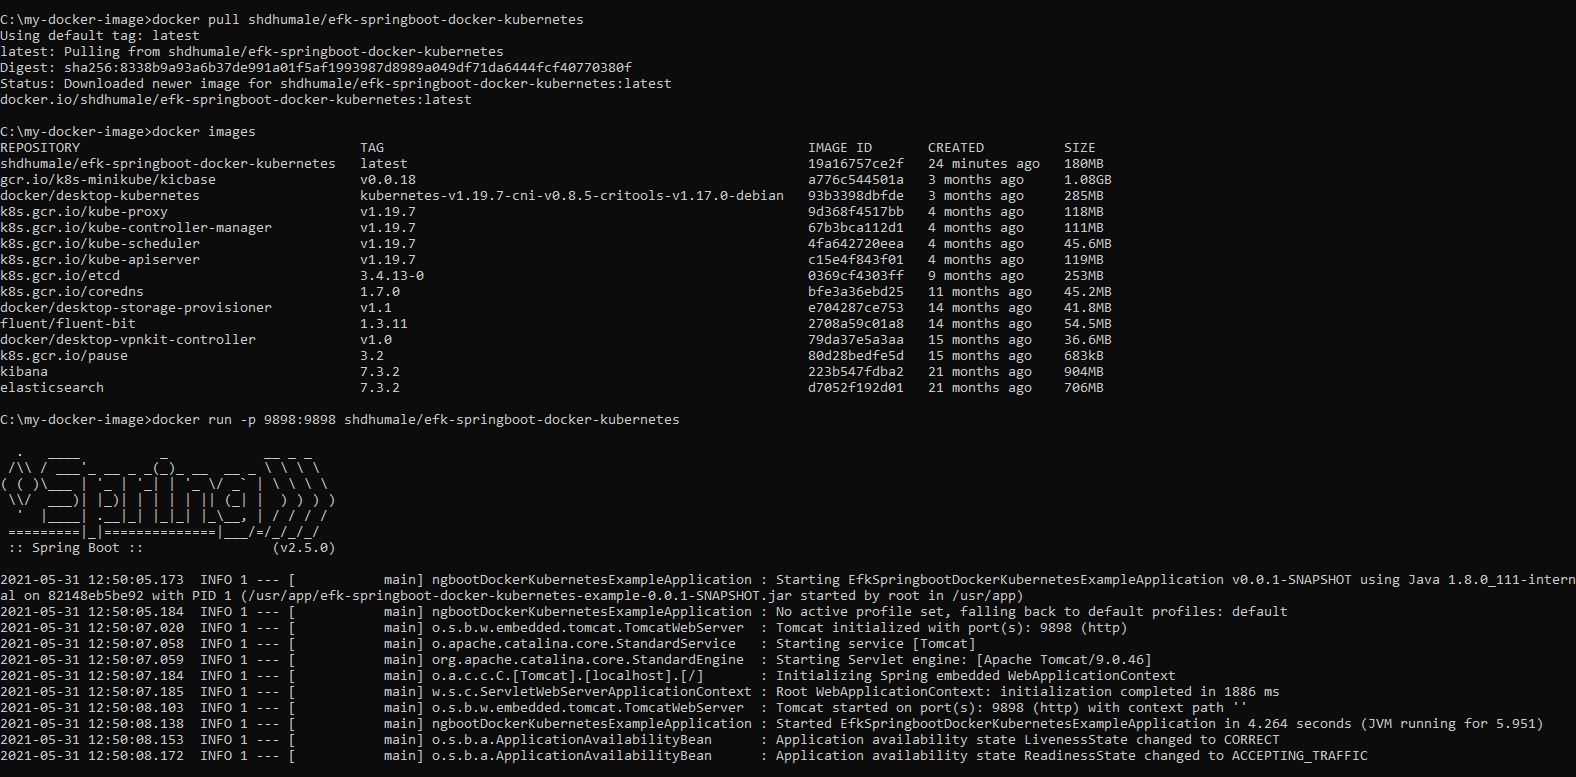
Now lets run the docker images just created using below command.
docker run -p 9898:9898 shdhumale/efk-springboot-docker-kubernetes

execute
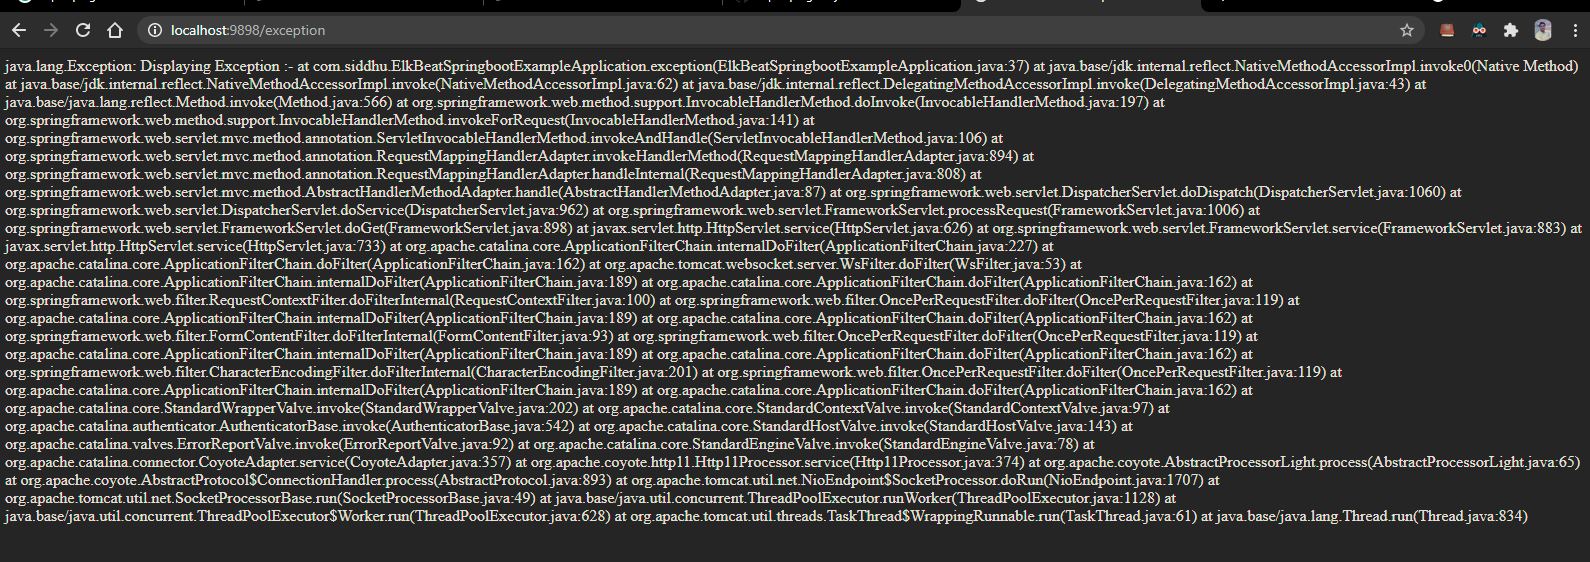
http://localhost:9898/siddhu and http://localhost:9898/exception
and you will be able to see the output properly.
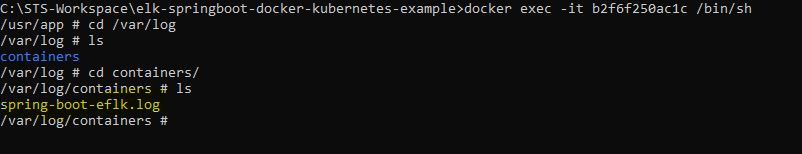
Check if we are able to see the log in our desired folder using below command
docker ps
Take docker container id and run below command on it

docker exec -it /bin/sh
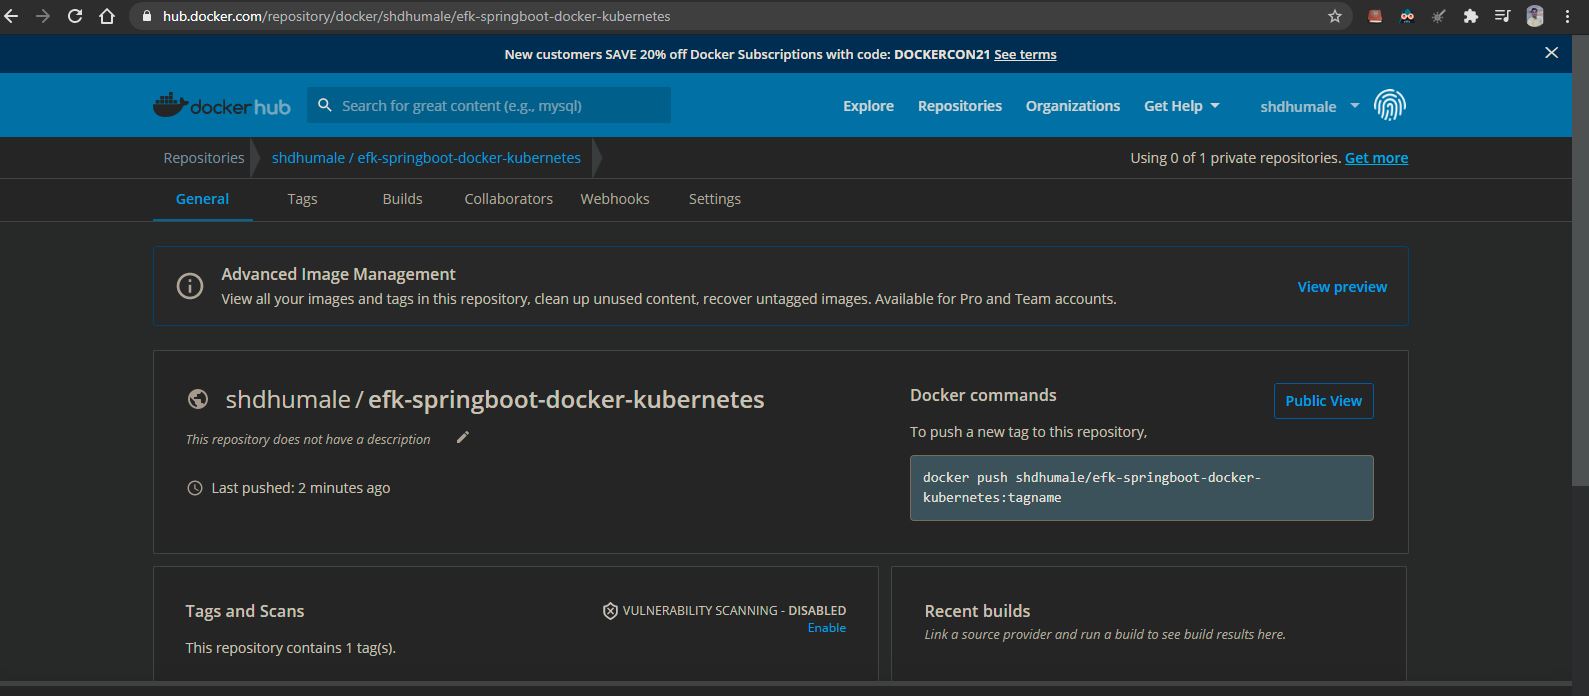
4- Upload the SpringBoot application Docker Image on Hub using below command
docker image push shdhumale/efk-springboot-docker-kubernetes

Note:- Lets check we are able to downlaod our image and run it locally
docker pull shdhumale/efk-springboot-docker-kubernetes
5- Finally make the following changes
a:- Deploy our spring boot application using kubernetes.
For that we need to prepare first our deployment yaml file give below
1- siddhu-springboot.yaml
apiVersion: apps/v1
kind: Deployment
metadata:
  name: siddhuspringboot
  namespace: kube-logging
spec:
  selector:
    matchLabels:
      component: siddhuspringboot
  template:
    metadata:
      labels:
        component: siddhuspringboot
    spec:
      containers:
      - name: siddhuspringboot
        image: shdhumale/efk-springboot-docker-kubernetes:latest
        env:
        - name: discovery.type
          value: single-node
        ports:
        - containerPort: 9898
          name: http
          protocol: TCP

---

apiVersion: v1
kind: Service
metadata:
  name: siddhuspringboot
  namespace: kube-logging
  labels:
    service: siddhuspringboot
spec:
  type: NodePort
  selector:
    component: siddhuspringboot
  ports:
  - port: 9898
    targetPort: 9898
b:- execute this file with below command.
kubectl create -f siddhu-springboot.yaml
C:\STS-Workspace\efk-springboot-docker-kubernetes-example\ymlfile>kubectl create -f siddhu-springboot.yaml
deployment.apps/siddhuspringboot created
service/siddhuspringboot created
check if the pod is deployed properly
Now check if our application is working properly using forward port command.
kubectl port-forward 9898:9898 -n kube-logging
Hit the url and check we are able to get the output as expected.
http://localhost:9898/exception and http://localhost:9898/siddhu
Now check in our kibana that we are able to get the log of our spring boot application

Download :- https://github.com/shdhumale/efk-springboot-docker-kubernetes-example.git