Please follow below step religiously to install Prometheus and Grafana using Helm K8 Package manager. We are using Docker Desktop for windows and Minikube for K8 cluster on window machine.
Step 1:- Start/check the Docker

Step 2:- Start Minikube using below command
C:\Users\Siddhartha>minikube start
- minikube v1.18.1 on Microsoft Windows 10 Enterprise LTSC 2019 10.0.17763 Build 17763
- Using the docker driver based on existing profile
- Starting control plane node minikube in cluster minikube
- Pulling base image …
- Restarting existing docker container for “minikube” …
- Preparing Kubernetes v1.20.2 on Docker 20.10.3 …
- Verifying Kubernetes components…
! Executing “docker container inspect minikube –format={{.State.Status}}” took an unusually long time: 2.8144241s - Restarting the docker service may improve performance.
- Using image gcr.io/k8s-minikube/storage-provisioner:v4
- Enabled addons: storage-provisioner, default-storageclass
- Done! kubectl is now configured to use “minikube” cluster and “default” namespace by default

Step 3:- Add helm repo locally i.e add the repository to our helm configuration using belwo command. We are going to use https://github.com/prometheus-community/helm-charts git repo.
C:\Users\Siddhartha>helm repo add prometheus-community https://prometheus-community.github.io/helm-charts
“prometheus-community” has been added to your repositories

Step 4:- check we have prometheus in our K8 using below command
C:\Users\Siddhartha>helm repo list
NAME URL
stable https://charts.helm.sh/stable
bitnami https://charts.bitnami.com/bitnami
prometheus-community https://prometheus-community.github.io/helm-charts

Once the repo is ready, we can install the provided charts by running the following commands:
helm install prometheus prometheus-community/prometheus
C:\Users\Siddhartha>helm install prometheus prometheus-community/prometheus
NAME: prometheus
LAST DEPLOYED: Wed Apr 21 18:11:36 2021
NAMESPACE: default
STATUS: deployed
REVISION: 1
TEST SUITE: None
NOTES:
The Prometheus server can be accessed via port 80 on the following DNS name from within your cluster:
prometheus-server.default.svc.cluster.local


Get the Prometheus server URL by running these commands in the same shell:
  export POD_NAME=$(kubectl get pods --namespace default -l "app=prometheus,component=server" -o jsonpath="{.items[0].metadata.name}")
  kubectl --namespace default port-forward $POD_NAME 9090


The Prometheus alertmanager can be accessed via port 80 on the following DNS name from within your cluster:
prometheus-alertmanager.default.svc.cluster.local


Get the Alertmanager URL by running these commands in the same shell:
  export POD_NAME=$(kubectl get pods --namespace default -l "app=prometheus,component=alertmanager" -o jsonpath="{.items[0].metadata.name}")
  kubectl --namespace default port-forward $POD_NAME 9093
#################################################################################
######   WARNING: Pod Security Policy has been moved to a global property.  #####
######            use .Values.podSecurityPolicy.enabled with pod-based      #####
######            annotations                                               #####
######            (e.g. .Values.nodeExporter.podSecurityPolicy.annotations) #####
#################################################################################


The Prometheus PushGateway can be accessed via port 9091 on the following DNS name from within your cluster:
prometheus-pushgateway.default.svc.cluster.local


Get the PushGateway URL by running these commands in the same shell:
  export POD_NAME=$(kubectl get pods --namespace default -l "app=prometheus,component=pushgateway" -o jsonpath="{.items[0].metadata.name}")
  kubectl --namespace default port-forward $POD_NAME 9091

For more information on running Prometheus, visit:
https://prometheus.io/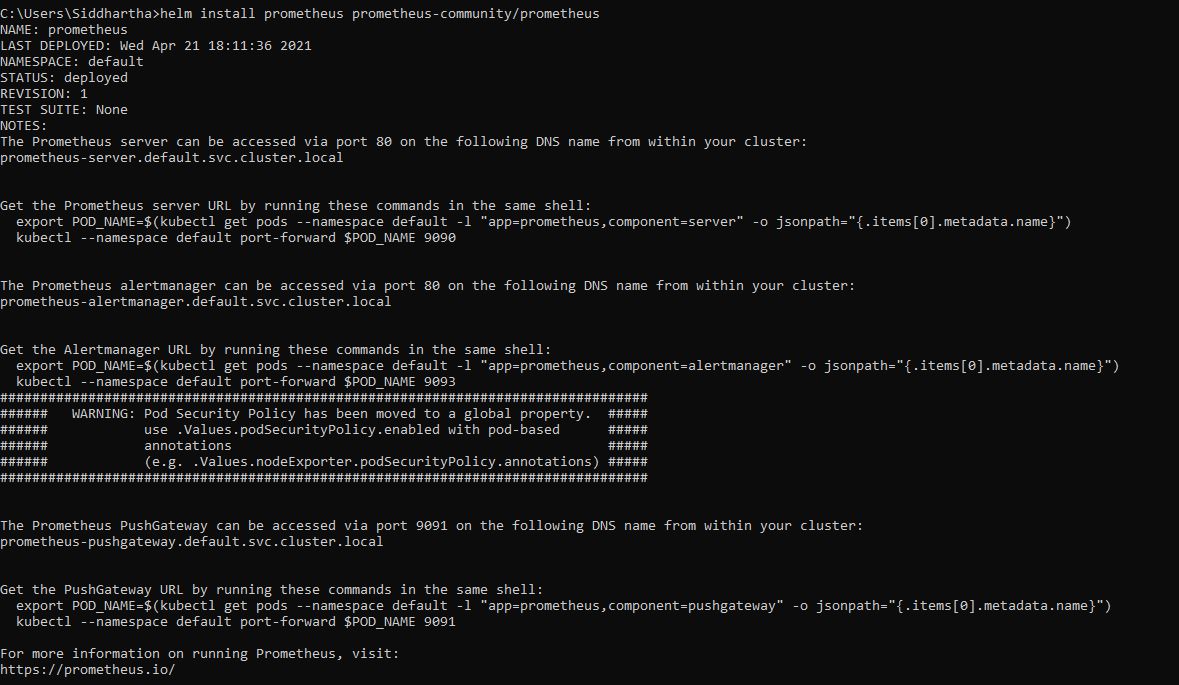
Now we will expose the service and check if we are able to access prometheus install in K8 using belwo command
kubectl expose service prometheus-server –type=NodePort –target-port=9090 –name=prometheus-server-np
Above command exposes the prometheus-server Pod using a NodePort. Now we can easily access the Prometheus web interface when the Pod is ready:
Execute belwo command
minikube service prometheus-server-np
C:\Users\Siddhartha>minikube service prometheus-server-np
|-----------|----------------------|-------------|---------------------------|
| NAMESPACE |         NAME         | TARGET PORT |            URL            |
|-----------|----------------------|-------------|---------------------------|
| default   | prometheus-server-np |          80 | http://192.168.49.2:31553 |
|-----------|----------------------|-------------|---------------------------|
* Starting tunnel for service prometheus-server-np.
|-----------|----------------------|-------------|------------------------|
| NAMESPACE |         NAME         | TARGET PORT |          URL           |
|-----------|----------------------|-------------|------------------------|
| default   | prometheus-server-np |             | http://127.0.0.1:61969 |
|-----------|----------------------|-------------|------------------------|
* Opening service default/prometheus-server-np in default browser...
! Because you are using a Docker driver on windows, the terminal needs to be open to run it.
Now open the browser and hit this url and we will be able to access the prometheus web applicaiton as shown below.

Note: As shown above you can also expose the pod url or clusterip using port forward
kubectl –namespace default port-forward <POD NAME> 9090
C:\Users\Siddhartha>kubectl get all
NAME                                                 READY   STATUS    RESTARTS   AGE
pod/prometheus-alertmanager-ccf8f68cd-nms2j          2/2     Running   0          73s
pod/prometheus-kube-state-metrics-685b975bb7-jb28w   1/1     Running   0          73s
pod/prometheus-node-exporter-fnszj                   1/1     Running   0          73s
pod/prometheus-pushgateway-74cb65b858-nrqnh          1/1     Running   0          73s
pod/prometheus-server-d9fb67455-gknbg                2/2     Running   0          73s

NAME                                    TYPE        CLUSTER-IP       EXTERNAL-IP   PORT(S)    AGE
service/kubernetes                      ClusterIP   10.96.0.1        <none>        443/TCP    36m
service/prometheus-alertmanager         ClusterIP   10.96.38.206     <none>        80/TCP     74s
service/prometheus-kube-state-metrics   ClusterIP   10.103.91.41     <none>        8080/TCP   74s
service/prometheus-node-exporter        ClusterIP   None             <none>        9100/TCP   75s
service/prometheus-pushgateway          ClusterIP   10.101.186.237   <none>        9091/TCP   74s
service/prometheus-server               ClusterIP   10.110.140.42    <none>        80/TCP     74s

NAME                                      DESIRED   CURRENT   READY   UP-TO-DATE   AVAILABLE   NODE SELECTOR   AGE
daemonset.apps/prometheus-node-exporter   1         1         1       1            1           <none>          74s

NAME                                            READY   UP-TO-DATE   AVAILABLE   AGE
deployment.apps/prometheus-alertmanager         1/1     1            1           73s
deployment.apps/prometheus-kube-state-metrics   1/1     1            1           73s
deployment.apps/prometheus-pushgateway          1/1     1            1           73s
deployment.apps/prometheus-server               1/1     1            1           73s

NAME                                                       DESIRED   CURRENT   READY   AGE
replicaset.apps/prometheus-alertmanager-ccf8f68cd          1         1         1       73s
replicaset.apps/prometheus-kube-state-metrics-685b975bb7   1         1         1       73s
replicaset.apps/prometheus-pushgateway-74cb65b858          1         1         1       73s
replicaset.apps/prometheus-server-d9fb67455                1         1         1       73s

C:\Users\Siddhartha>kubectl --namespace default port-forward prometheus-server-d9fb67455-gknbg 9090
Forwarding from 127.0.0.1:9090 -> 9090
Forwarding from [::1]:9090 -> 9090
Step 4- Now lets install Grafana in our K8 i.e. minikube. we will use this https://github.com/grafana/helm-charts
Lets add add the repository to our helm configuration:
C:\Users\Siddhartha>helm repo add grafana https://grafana.github.io/helm-charts
“grafana” has been added to your repositories

Step 5- we install Grafana by using the provided charts:
C:\Users\Siddhartha>helm install grafana stable/grafana
WARNING: This chart is deprecated
W0421 18:37:14.661253   12180 warnings.go:70] rbac.authorization.k8s.io/v1beta1 Role is deprecated in v1.17+, unavailable in v1.22+; use rbac.authorization.k8s.io/v1 Role
W0421 18:37:14.670171   12180 warnings.go:70] rbac.authorization.k8s.io/v1beta1 RoleBinding is deprecated in v1.17+, unavailable in v1.22+; use rbac.authorization.k8s.io/v1 RoleBinding
W0421 18:37:16.581557   12180 warnings.go:70] rbac.authorization.k8s.io/v1beta1 Role is deprecated in v1.17+, unavailable in v1.22+; use rbac.authorization.k8s.io/v1 Role
W0421 18:37:16.764760   12180 warnings.go:70] rbac.authorization.k8s.io/v1beta1 RoleBinding is deprecated in v1.17+, unavailable in v1.22+; use rbac.authorization.k8s.io/v1 RoleBinding
NAME: grafana
LAST DEPLOYED: Wed Apr 21 18:37:14 2021
NAMESPACE: default
STATUS: deployed
REVISION: 1
NOTES:
*******************
****DEPRECATED*****
*******************
* The chart is deprecated. Future development has been moved to https://github.com/grafana/helm2-grafana

1. Get your 'admin' user password by running:

   kubectl get secret --namespace default grafana -o jsonpath="{.data.admin-password}" | base64 --decode ; echo

2. The Grafana server can be accessed via port 80 on the following DNS name from within your cluster:

   grafana.default.svc.cluster.local

   Get the Grafana URL to visit by running these commands in the same shell:

     export POD_NAME=$(kubectl get pods --namespace default -l "app.kubernetes.io/name=grafana,app.kubernetes.io/instance=grafana" -o jsonpath="{.items[0].metadata.name}")
     kubectl --namespace default port-forward $POD_NAME 3000

3. Login with the password from step 1 and the username: admin
#################################################################################
######   WARNING: Persistence is disabled!!! You will lose your data when   #####
######            the Grafana pod is terminated.                            #####
#################################################################################

Lets expose grafana using this nodeport using belwo command
kubectl expose service grafana –type=NodePort –target-port=3000 –name=grafana-np
C:\Users\Siddhartha>kubectl expose service grafana --type=NodePort --target-port=3000 --name=grafana-np
service/grafana-np exposed

Now as we are using Minikube, in order to easily access Grafana’s Web interface we expose the service as a NodePort.
minikube service grafana-np
C:\Users\Siddhartha>minikube service grafana-np
|-----------|------------|-------------|---------------------------|
| NAMESPACE |    NAME    | TARGET PORT |            URL            |
|-----------|------------|-------------|---------------------------|
| default   | grafana-np |          80 | http://192.168.49.2:30941 |
|-----------|------------|-------------|---------------------------|
* Starting tunnel for service grafana-np.
|-----------|------------|-------------|------------------------|
| NAMESPACE |    NAME    | TARGET PORT |          URL           |
|-----------|------------|-------------|------------------------|
| default   | grafana-np |             | http://127.0.0.1:62207 |
|-----------|------------|-------------|------------------------|
* Opening service default/grafana-np in default browser...
! Because you are using a Docker driver on windows, the terminal needs to be open to run it.


Note: As shown above you can also expose the pod url or clusterip using port forward
kubectl –namespace default port-forward <POD NAME> 3000
C:\Users\Siddhartha>kubectl get all
NAME                                                 READY   STATUS    RESTARTS   AGE
pod/grafana-6cb465dc65-hs2kj                         1/1     Running   0          12m
pod/prometheus-alertmanager-ccf8f68cd-nms2j          2/2     Running   0          14m
pod/prometheus-kube-state-metrics-685b975bb7-jb28w   1/1     Running   0          14m
pod/prometheus-node-exporter-fnszj                   1/1     Running   0          14m
pod/prometheus-pushgateway-74cb65b858-nrqnh          1/1     Running   0          14m
pod/prometheus-server-d9fb67455-gknbg                2/2     Running   0          14m

NAME                                    TYPE        CLUSTER-IP       EXTERNAL-IP   PORT(S)    AGE
service/grafana                         ClusterIP   10.105.29.192    <none>        80/TCP     12m
service/kubernetes                      ClusterIP   10.96.0.1        <none>        443/TCP    49m
service/prometheus-alertmanager         ClusterIP   10.96.38.206     <none>        80/TCP     14m
service/prometheus-kube-state-metrics   ClusterIP   10.103.91.41     <none>        8080/TCP   14m
service/prometheus-node-exporter        ClusterIP   None             <none>        9100/TCP   14m
service/prometheus-pushgateway          ClusterIP   10.101.186.237   <none>        9091/TCP   14m
service/prometheus-server               ClusterIP   10.110.140.42    <none>        80/TCP     14m

NAME                                      DESIRED   CURRENT   READY   UP-TO-DATE   AVAILABLE   NODE SELECTOR   AGE
daemonset.apps/prometheus-node-exporter   1         1         1       1            1           <none>          14m

NAME                                            READY   UP-TO-DATE   AVAILABLE   AGE
deployment.apps/grafana                         1/1     1            1           12m
deployment.apps/prometheus-alertmanager         1/1     1            1           14m
deployment.apps/prometheus-kube-state-metrics   1/1     1            1           14m
deployment.apps/prometheus-pushgateway          1/1     1            1           14m
deployment.apps/prometheus-server               1/1     1            1           14m

NAME                                                       DESIRED   CURRENT   READY   AGE
replicaset.apps/grafana-6cb465dc65                         1         1         1       12m
replicaset.apps/prometheus-alertmanager-ccf8f68cd          1         1         1       14m
replicaset.apps/prometheus-kube-state-metrics-685b975bb7   1         1         1       14m
replicaset.apps/prometheus-pushgateway-74cb65b858          1         1         1       14m
replicaset.apps/prometheus-server-d9fb67455                1         1         1       14m

C:\Users\Siddhartha>kubectl --namespace default port-forward grafana-6cb465dc65-hs2kj 3000
Forwarding from 127.0.0.1:3000 -> 3000
Forwarding from [::1]:3000 -> 300
Grafana is password protected. So we need to create a secret so that we can use the default password.
kubectl get secret –namespace default grafana -o jsonpath=”{.data.admin-password}”
you will get encoded value of your admin password
C:\Users\Siddhartha>kubectl get secret --namespace default grafana -o jsonpath="{.data.admin-password}"
R1FpYkg3TFFJTnk3djEzaUl1QTFxY3RZOUVoSU5IRGpJaGxCM2JEbA==
Now lets use this online site to decode this base64

and now you can use this as a password in grafana.
GQibH7LQINy7v13iIuA1qctY9EhINHDjIhlB3bDl

Now you will be able to loggin to Grafana

Now there are many ways to create Dashboard in Grafana we are not going to create a complete new but instead we are going to import a ready made created dashboard. Please follow below step religiously.


Congratulation you have configure Grafan with prometheus to monitor your Kubernetes cluster.


No comments:
Post a Comment