Please refer to the below blog where we had configured our Spring boot application with Prometheus
http://siddharathadhumale.blogspot.com/2021/04/monitoring-microservice-using.html
Also please refer to the grafana installation in below blog
http://siddharathadhumale.blogspot.com/2021/04/grafana-with-mysql.html
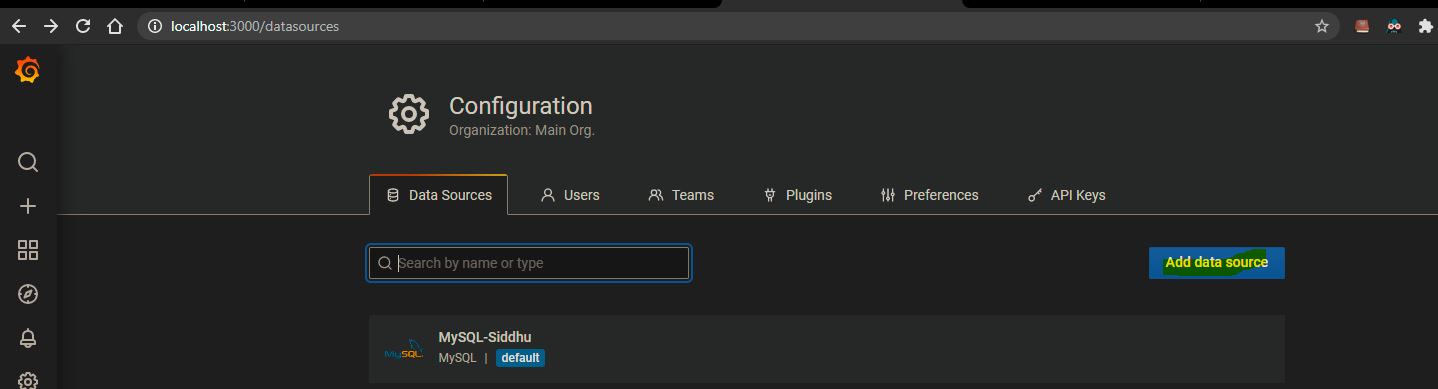
Having consider that we already have our both Prometheus and Grafana running now lets configure our first dashboard to show the prometheus metrics data in grafana.
Please follow the below step religiously


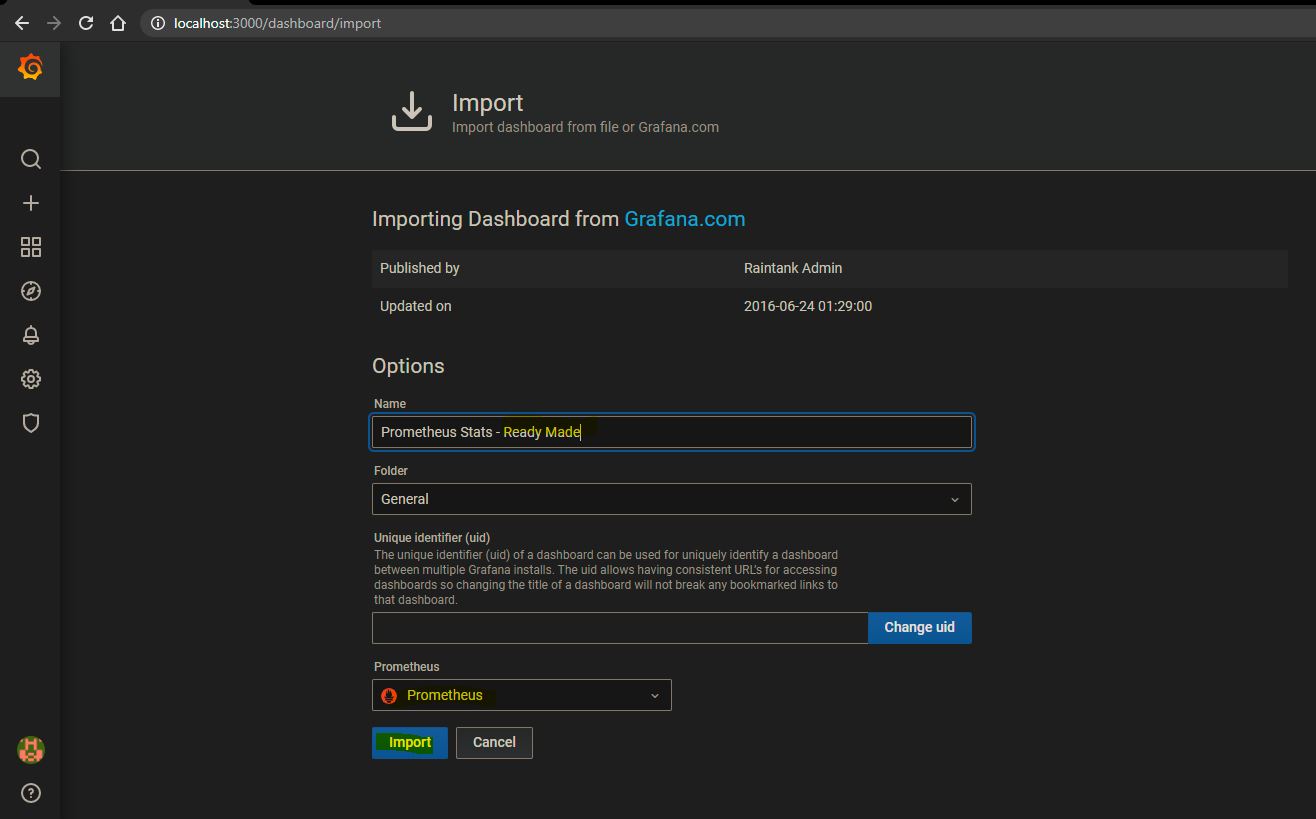
You can also use the ready made Grafana dashboard as shown below
https://grafana.com/grafana/dashboards/2


You can manage your deshboard using below options


No comments:
Post a Comment