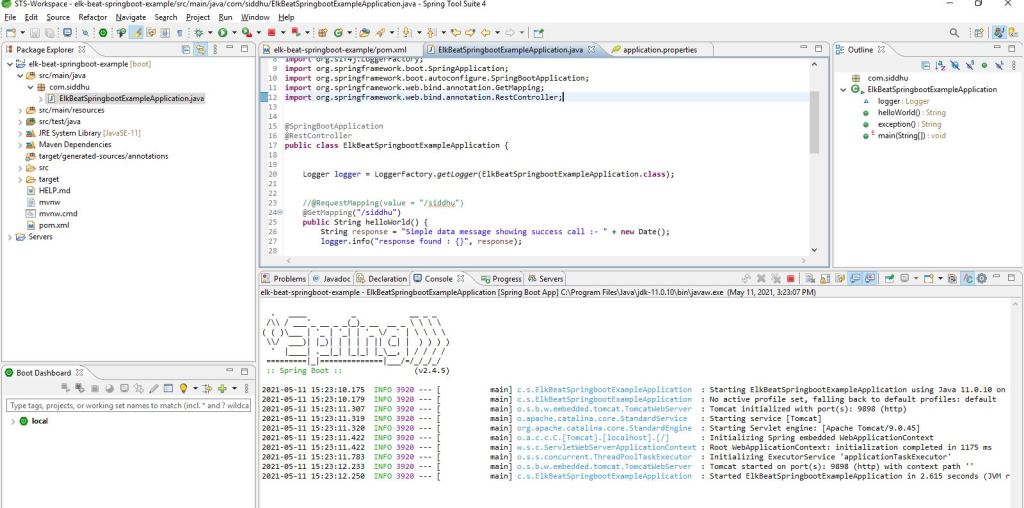
Please refer to the below URL for understanding ELK stack and how its work with live example.
http://siddharathadhumale.blogspot.com/2021/05/elk-stack-for-monitoring-microservice.html
In this article we will try to understand the use of Beat in ELK centralize monitoring stack.
Generally in ELK stack L=Logstash is deployed on every server which run the microservice so that it can collect, transfer , format and push the log to Elasticsearch. But Logstash is huge resource consuming and resource utilization tool. It is not good practice to have this logstash to installed/deployed on every server that has microservice running on it. In this case Beat comes in to the picture.
Beat is Light weight Shipper that reside on each and every microservice server and collect the log and send it to centralize logstash. In this way we make all the Microservice free of having its own logstash installtion and its resource consuming approach.
So the architecture will be
Microservice + Beat (Running on server1.1, Running on server1.2,Running on server1.3)–> Logstash (Running on server2)–> Elastic Search (Running on server3)–> Kibana(Running on server4)
There are large number of beat available but for us as we are using only log file to be transfer we are using file beat light weight shipper.
Now let try to follow below steps
1- Create a simple spring boot application that will produce the log file
2- Install Beat and configure it to read this log files and send it to particular port from where logstash will read it.
3- Install Elastic search and configure it to inform where logstash is listening
4- Install logstash and configure beat in it so that it can read the data send by file beat.
5- Install kibana and configure the indices of logstash to see the logs.
1- Create a simple spring boot application that will produce the log file
Follow below step religiously.
Now lets create the necessary files to expose the rest service.
1- ElkBeatSpringbootExampleApplication
package com.siddhu;

import java.io.PrintWriter;
import java.io.StringWriter;
import java.util.Date;

import org.springframework.beans.factory.annotation.Autowired;
import org.springframework.boot.SpringApplication;
import org.springframework.boot.autoconfigure.SpringBootApplication;
import org.springframework.context.annotation.Bean;
import org.springframework.web.bind.annotation.RequestMapping;
import org.springframework.web.bind.annotation.RestController;
import org.springframework.web.client.RestTemplate;
import org.slf4j.Logger;
import org.slf4j.LoggerFactory;


@SpringBootApplication
@RestController
public class ElkBeatSpringbootExampleApplication {

	public static void main(String[] args) {
		SpringApplication.run(ElkBeatSpringbootExampleApplication.class, args);
	}

	private static final Logger logger = LoggerFactory.getLogger(ElkBeatSpringbootExampleApplication.class.getName());

	@Autowired
	RestTemplate restTemplete;

	@Bean
	RestTemplate restTemplate() {
		return new RestTemplate();
	}

	@RequestMapping(value = "/siddhu")
	public String helloWorld() {
		String response = "Simple data message showing success call :- " + new Date();
		logger.info(response);

		return response;
	}

	@RequestMapping(value = "/exception")
	public String exception() {
		String response = "";
		try {
			throw new Exception("Displaying Exception :- ");
		} catch (Exception e) {
			e.printStackTrace();
			logger.error("Exception Created:",e);

			StringWriter sw = new StringWriter();
			PrintWriter pw = new PrintWriter(sw);
			e.printStackTrace(pw);
			String stackTrace = sw.toString();
			logger.error("Exception stackTrace- " + stackTrace);
			response = stackTrace;
		}

		return response;
	}

}
2- pom.xml
<?xml version="1.0" encoding="UTF-8"?>
<project xmlns="http://maven.apache.org/POM/4.0.0" xmlns:xsi="http://www.w3.org/2001/XMLSchema-instance"
	xsi:schemaLocation="http://maven.apache.org/POM/4.0.0 https://maven.apache.org/xsd/maven-4.0.0.xsd">
	<modelVersion>4.0.0</modelVersion>
	<parent>
		<groupId>org.springframework.boot</groupId>
		<artifactId>spring-boot-starter-parent</artifactId>
		<version>2.4.5</version>
		<relativePath/> <!-- lookup parent from repository -->
	</parent>
	<groupId>com.siddhu</groupId>
	<artifactId>elk-beat-springboot-example</artifactId>
	<version>0.0.1-SNAPSHOT</version>
	<name>elk-beat-springboot-example</name>
	<description>Demo project for Spring Boot Integration with ELK Stack using Beat</description>
	<properties>
		<java.version>11</java.version>
	</properties>
	<dependencies>
		<dependency>
			<groupId>org.springframework.boot</groupId>
			<artifactId>spring-boot-starter-web</artifactId>
		</dependency>

		<dependency>
			<groupId>org.springframework.boot</groupId>
			<artifactId>spring-boot-starter-test</artifactId>
			<scope>test</scope>
		</dependency>
	</dependencies>

	<build>
		<plugins>
			<plugin>
				<groupId>org.springframework.boot</groupId>
				<artifactId>spring-boot-maven-plugin</artifactId>
			</plugin>
		</plugins>
	</build>

</project>
3- application.properties
spring.application.name=EFLK-Example
server.port=9898
logging.file.name=C:/springboot-log/spring-boot-eflk.log
2- Install Elastic search
Download the latest version of elasticsearch from Elasticsearch downloads
https://www.elastic.co/downloads/elasticsearch
Star the Elatic search
C:\elasticsearch-7.12.1\bin>elasticsearch

3- Install kibana and configure the indices of logstash to see the logs.
Download the latest version of kibana from Kibana downloads
https://www.elastic.co/downloads/kibana
Uncomment below line from kibana.conf file
The URLs of the Elasticsearch instances to use for all your queries.
elasticsearch.hosts: [“http://localhost:9200”%5D
Start the kibana server
C:\kibana-7.12.1-windows-x86_64\bin>kibana

3- Install logstash and configure beat in it so that it can read the data send by file beat.
Download the latest version of logstash from Logstash downloads
https://www.elastic.co/downloads/logstash
Create a file logstash-elfk.conf inside conf folder of logstash
C:\logstash-7.12.1\config
logstash-elfk.conf
# Read input from filebeat by listening to port 5044 on which filebeat will send the data
input {
    beats {
	    type => "test"
        port => "5044"
    }
}

filter {
  #If log line contains tab character followed by 'at' then we will tag that entry as stacktrace
  if [message] =~ "\tat" {
    grok {
      match => ["message", "^(\tat)"]
      add_tag => ["stacktrace"]
    }
  }

}

output {

  stdout {
    codec => rubydebug
  }

  # Sending properly parsed log events to elasticsearch
  elasticsearch {
    hosts => ["localhost:9200"]
	index => "%{[@metadata][beat]}-%{[@metadata][version]}-%{+YYYY.MM.dd}"
  }
}
start the logstash using below command
C:\logstash-7.12.1\bin>logstash ../config/logstash-ELFK.conf
4- Install File Beat and configure it to read this log files and send it to perticular port from where logstash will read it.
Download filebeat from FileBeat Download
https://www.elastic.co/downloads/beats/filebeat
Modify filebeat.yml and add the following content
      paths:
        - C:/springboot-log/*.log
      input_type: log
      multiline.pattern: '^[0-9]{4}-[0-9]{2}-[0-9]{2}'
      multiline.negate: true
      multiline.match: after

output:
  logstash:
    hosts: ["localhost:5044"]

Start filebeat as follows-
filebeat.exe -c filebeat.yml


Now lets start the microservice and hit the url
Now you can see logstash has created a new indice for us as show below
Download :- https://github.com/shdhumale/elk-beat-springboot-example.git
I had added following file in the same project for your reference
1- filebeat.yml
2- kibana.yml
3- logstash-elfk.conf


No comments:
Post a Comment